$ETH Sold at $335 - Now Back in Long at $230 - Here is Why
- Momentum Stock Alerts
- Sep 6, 2017
- 2 min read
UPDATED - 9/14/17
BotTrigger Trade Alert: $ETH bought back in @ $230.24 bringing our entire allocation back to 20% long on ETH as a core position to the BotTrigger Crypto portfolio. We originally sold half of our ETH @ the $335 as we addressed concerns of the double top that was occurring whilst waning momentum was causing several bearish crossovers to occur on both stochastics & MACD. We later outlined that the most obvious retracement levels for this pullback would be anywhere from $266 to $233. We calculated those targets based on Fibonacci retracment levels that match up with key support levels. Today we've gotten a slight breach of our $233 level where ETH went as low as the $223 area. What's more, this entire move down is happening with earmarking volume surges that we typically only see during exhaustion tops or exhaustion bottoms. Take a look back at every ETH bottom and you'll notice the same type of volume surge come in off the lows. This is a form of both capitulation from weak hands that fold and yell uncle and mega whales that orchestrate massive buy orders around this area. We are back long on ETH here.
ORIGINAL POST - 9/6/17
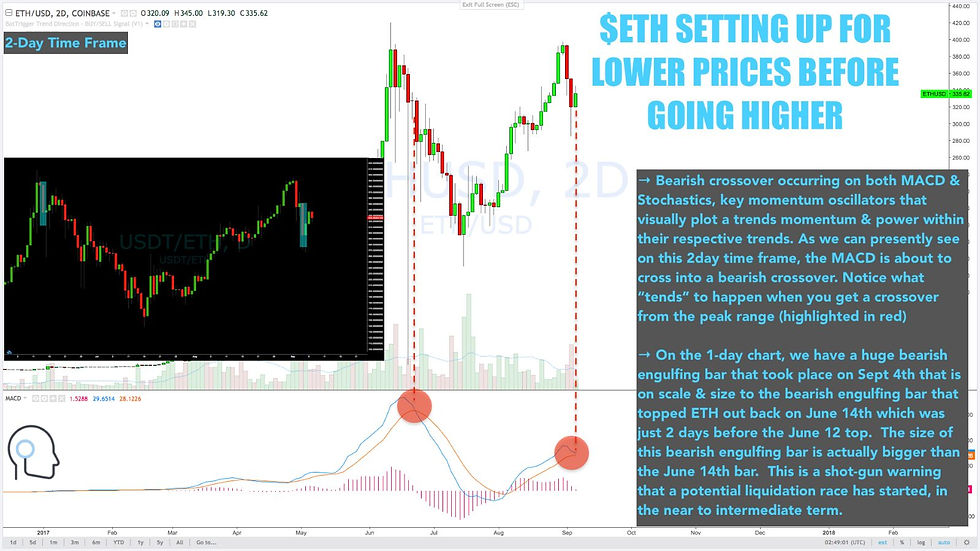
BotTrigger Crypto Trade Alert: $ETH sold 50% of our entire allocation ETH allocation @ $235.62. We're further monitoring $BTC as well here for a potential topping formation on the near to intermediate term. We are not bearish on crypto in general. We are in a bull market. We are simply trading around what we believe is likely to be a corrective period that is likely to retrace lower before moving higher. Just as we sold ETH back around the $366 level in mid June before the massive correction that ensued, we're noticing a similar setup that's presently brewing on both ETH & Bitcoin in the present moment. There is evidence to suggest that Crypto will see lower before seeing all time new highs on these 2. Let's go over why. 1) potential double top formation. Easy to say the phrase "double top" ...but why: The most recent revisit of the highs is occurring on waning momentum as key oscillators are starting to cross into a "bearish crossover." This occurs when the faster signal line (blue line) crosses underneath the slower MACD line (red line) as shown in the attachment. This is not just showing up on MACD but also the Stochastics momentum oscillator & on several key time frames. This alone however wouldn't get us to reduce our ETH exposure. The give away here is the giant "bearish engulfing" candle bar on the 1day chart that occurred on Sept 4th. This bar is just a tad bigger/deeper than the June 14th candle bar that avalanched ETH from the $408 high to the $138. No evidence just yet that a repeat is here. We're just mitigating risk by reducing for now. Shot gun warning


Comments