
Members Questions About Fed Repo & Head & Shoulder Potential Top
- Momentum Stock Alerts
- Jun 4, 2020
- 15 min read

We're going to address 3 things in this post:
1) A Member brought up a very obvious consideration regarding the Fed repo program & asked to what extent that is effecting the markets. I'm going to share my response
2) Another Member requested that I post the 2008 head & shoulders top that preceded the financial crisis. So let's outline exactly what that looked like & how it may be playing out in the current setup....what would negate or confirm that possibility.
3) The current SPY setup: are we pulling back or not.
1 → MEMBER A asked me the following:
Thoughts on spy? I have strong faith in spy coming down. Just curious about your thoughts on spy. This overnight repo helping with gap ups is bad. More gaps to fill on the downside....Also how much is this actually affecting the market right now (attached image)

Now he addressed a very valid point & I want to share my response because it's equally important we keep perspective. Specifically to address not getting stuck in the mindset of being a perma bear in a raging bull market or not making the mistake of becoming a perma bull in a bear market period. Here was my response:
that's perhaps the single biggest reason for these gap ups...effectively the FED is repricing the market via futures & setting the trading range for the exchange of asset prices to take place @ a higher level. Skipping organic/true price discovery & parlaying those exchanges in higher ranges. They're doing a great job in that respect. And yes the concept of "don't fight the fed" has never rang more true. However, either way there is programmed portfolio rebalancing that are pre-programmed on the worlds largest trading desks....you can bet on that. Like if a fund owns X% of AAPL for example...the fund is pre-programmed to reduce it's weighting once the stock has achieved X% above targets for example. Eventually you'll see more rebalancing that forces asset prices lower. And that really is just one aspect of a pullback cycle. The Fed did it's job...it's essentially brought the market back to a level before the covid crisis occurred. It was an engineered recession no doubt....so their forcibly countered that with their stimulus. I get it and in retrospect it would have been nice to assume that we were just going to get back to the highs so quickly...i didn't see this coming nor did many seasoned investors. Ok so what do we do now knowing what we know....well for one that doesn't mean we blindly long here in this area....the PE ratio of AAPL for example is already higher then it was when AAPL was trading around $330 back in late January of this year. AAPL's PE ratio is a record new high never before seen post financial crisis. That's not an environment where you want to be initiating new longs on AAPL @ record high PE ratios. That PE will undoubtedly contract. AAPL doesn't have to crash per se....but the PE ratio will go through a relative trough low i'm certain sooner than later. We just need to be patient. There are amazing long setups that we want to take advantage of but not up in this area
for example....the $BA January 2022 $280 / $300 call spread for $2.50 is one that we're watching. $TSLA January 21 $1000 / $1020 is another one once we can get a -20% pullback of some kind. I'm spitballing right now ...but there will be no shortage of high octane call spreads to acquire ...not here however...we need the pullback before we can get aggressively long.
What we don't want to do ....is get blindsided with bearishness that it makes us miss a true resumption of what has since been & likely still is a secular bull market. Many bears couldn't get out of their own way off the lows of the financial crisis...they remained bearish due to the bearish environment of the economy back near the lows....they couldn't accept that the recovery was real & taking place. they largely remained bearish till this day & failed to participate in the bull....that absolutely the last thing that we ever want to be. I have been a perma bull for example for the longest time. But this covid era isn't yet all clear how it's going to pan out....so we need to maintain caution both technically & fundamentally while at the same time doing our best to see the forest through the trees. So our plan will be to position offensively long on the next pullback cycle but model in a way that gives us the ability to weather through in the event that we're actually entering a more complex topping pattern into a bearish era for the markets. And even then, it won't be some kind of all or nothing play....even within bearish periods there are aggressively bullish sectors that out perform. The new highs on FB & many cloud plays for example, even MARK for example. So instead of trying to get some kind of profound rightness about "oh this is bear vs this is bull"....along the way we'll play the setups that are working as well. But I do care to discern what the F the market is doing on the larger trend...thus why the emphasis around the SPY at the moment. It's important with regards to directional scope & levity of asset prices
Ok so the main takeaway here is, and I want to make this clear, we're not going to just march along with this bearish tick on our analysis & directional thesis indefinitely like some disgrunteled bears. I almost loath bearish skeptics & their Marc Faber-esque views. At the end of the day I have alwyas believed & still do very much believe in the worlds, and very notably America's extraordinary business innovation to push new heights & boundaries in growth, earnings, & innovation at large. I'm a patriotic bull @ heart & due believe that the best investment is betting your chips long on quality American companies. But as I shared in my response to Member, we have to be cautiously considerate of the economic impact that may indeed residually temper growth expectations on what that means on the technical & fundamental setup on the intermediate term basis. I'm not going to get sucked in some echo chamber of being prodoundly right or wrong. I may very well have the analysis wrong regarding the SPY pulling back or retesting the lows or creating a higher low for that matter. But I'm going to layout the evidence for why that is still very much on the horizon. If & when proven wrong we will pivot accordingly. Until & alongside then, we're committed to exploiting pockets of bullish energy on select names
THE CURRENT SPY SETUP:
A few things to update on today. First, the SPY has pushed up to overbought levels now. It's at an 80-RSI at $312 which is probably where the SPY will peak out near-term. We should see a 2-3 point pull-back from there. Second, the NASDAQ is underperforming just as it approaches all-time highs. I can't think of a single rational person who wouldn't think that extremely silly given the economic environment. But that will be key to watch as tech is what lead this entire rally. Tech outperformed on the sell-off and way outperformed on the recovery. If the NASDAQ resists pushing to new highs and beyond, it's probably an indicator for the market as a whole. Especially the NASDAQ-100 which came within a whole $0.08 of within its intraday all-time highs:
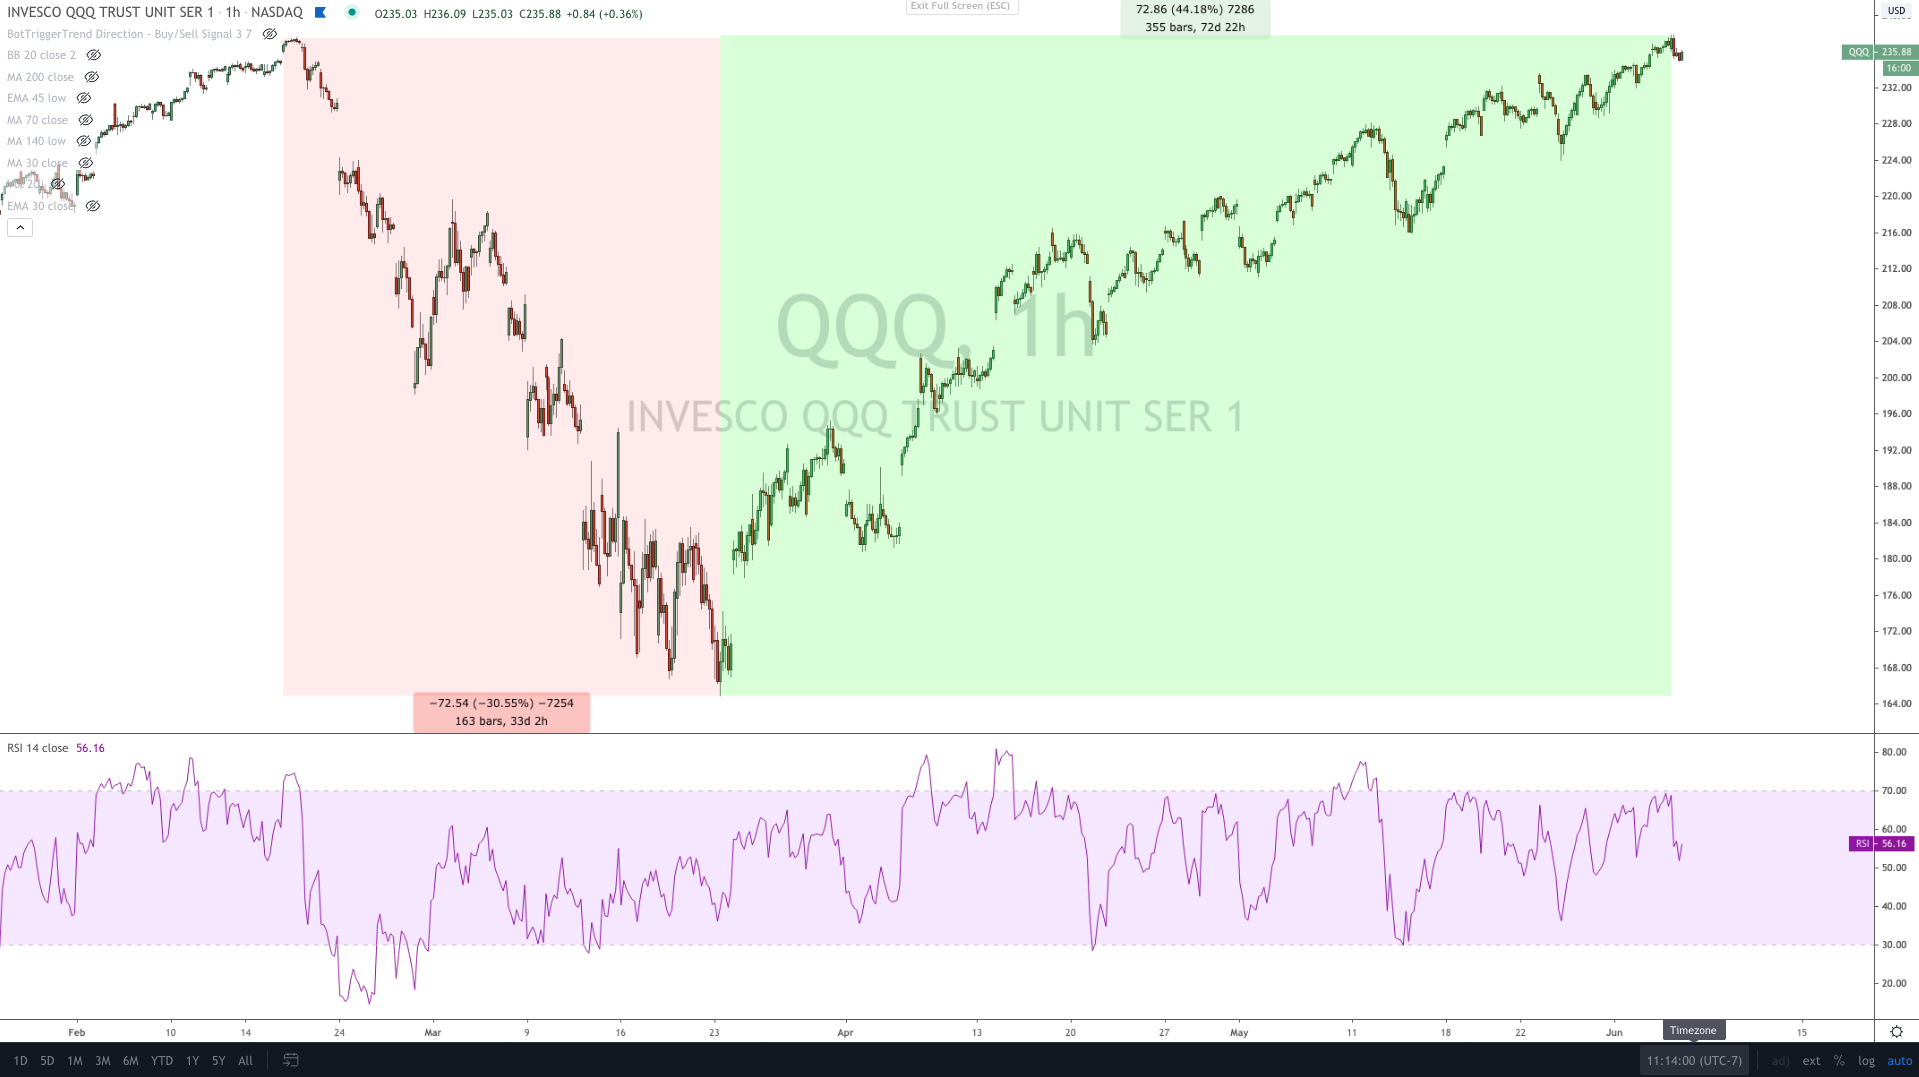
The hourly chart below shows the SPY pushing up to overbought territory hitting an 80-RSI today. Typically that precedes a few hours/days of selling. What's more, the SPY is up 13% in two and a half weeks which is extremely atypical. We never see the SPY just move up 13% in two weeks under any normal market environment. This isn't a melt-up. It's parabolic and will likely see a massive retracement as a result. The key difference between melt-up rallies and parabolic ones is that melt-up rallies can last a very long time. Parabolic rallies burn out a lot faster and that's where we are now:

The SPY has also pushed up to near overbought conditions on the daily and is moving to record distances above its 50-day moving average:
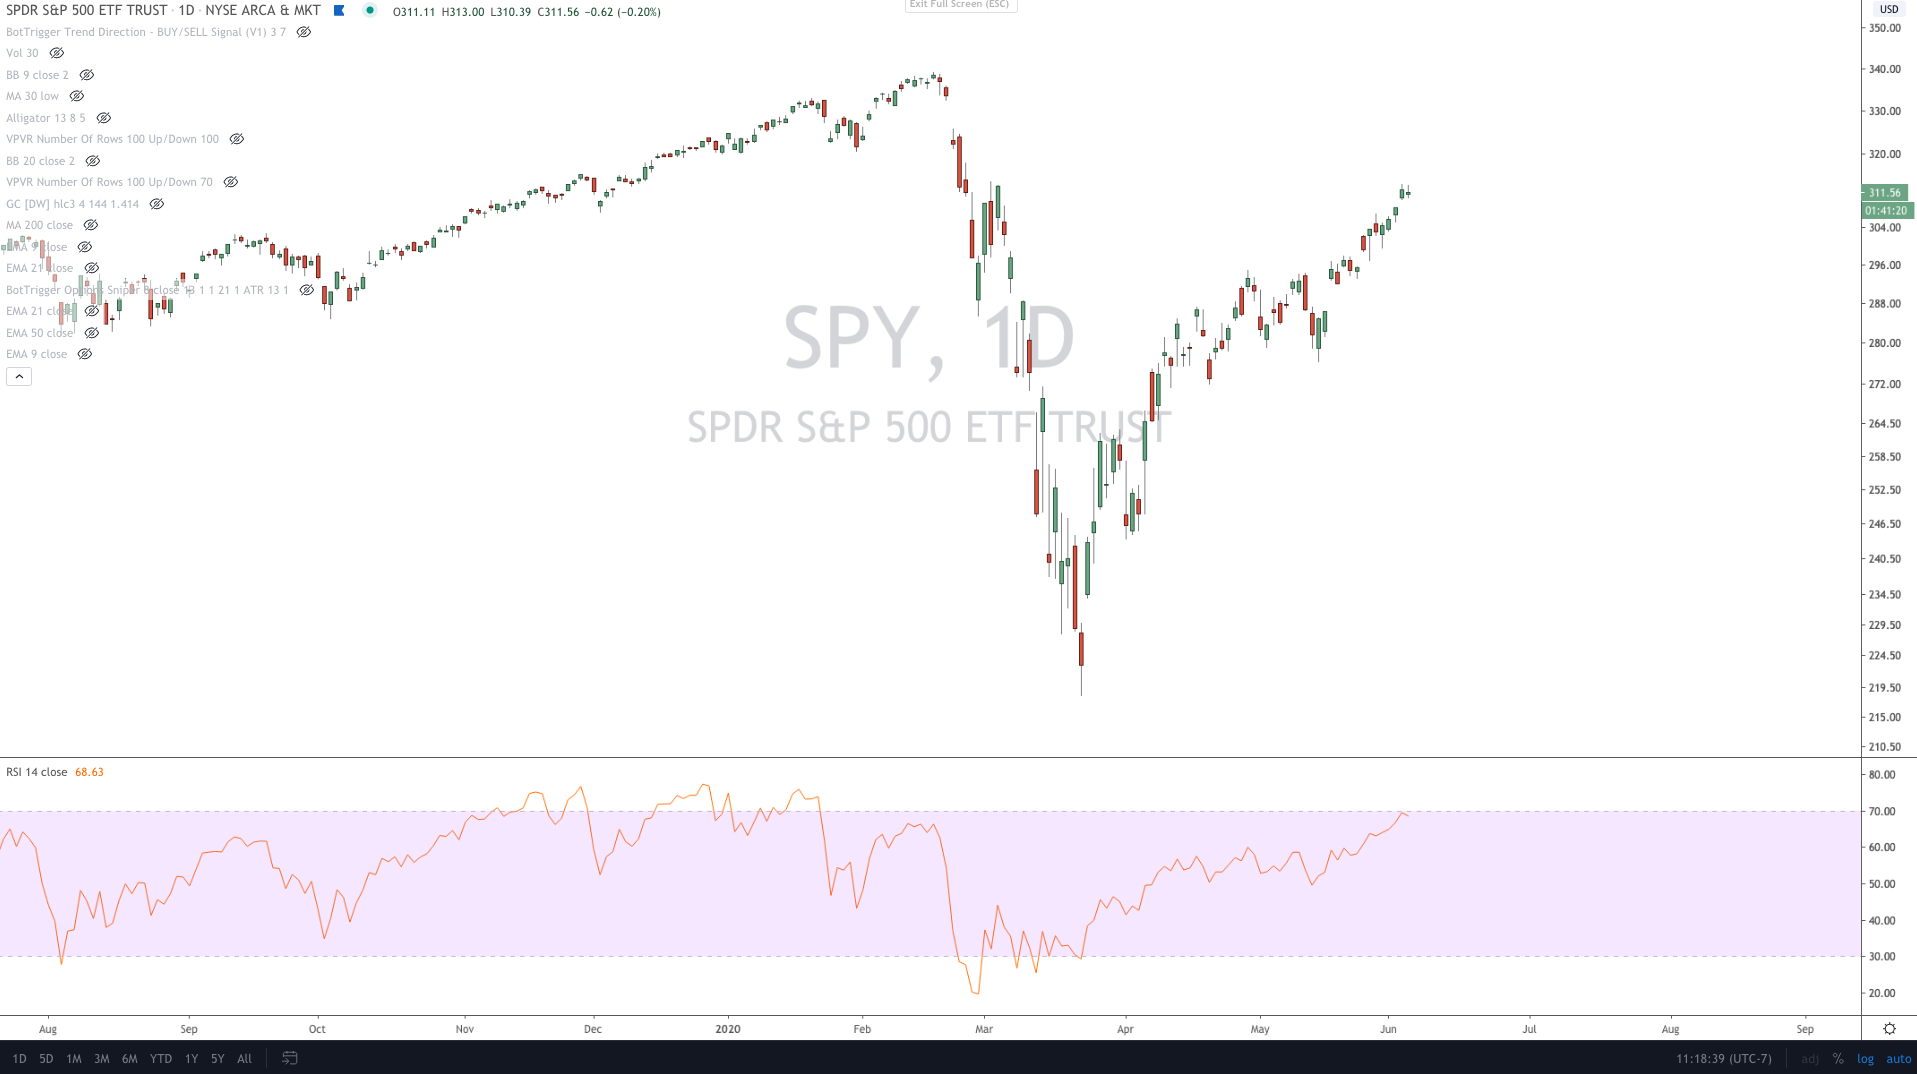
The SPY is currently 11% above its 50-day moving average. The previous record during the post-financial crisis era was roughly 7% and that didn't work out too well for the SPY. That was another parabolic move up as the SPY rallied 7.8% in a single month! Think about that. The last time the SPY shot up high above its 50-day, it rallied 7.8% in a month and that was a lot. We just saw the SPY move up 13% in two weeks time. This point right here shows the highest distance the SPY pushed above its 50-day before today:

Finally, the SPY is now up 43.11% in 2.5 months without a retracement. Again, that is entirely unprecedented especially given the economic uncertainty. It's not uncommon to see recoveries like that when the data or outlook improves. But with the economic data being as bad as it could get and with the outlook nearly as horrible, this rally makes absolutely no sense fundamentally speaking. A report published by the Becker Friedman Institute at the University of Chicago suggests that as many as half of the job losses we've seen from Covid-19 will become permanent job losses. If even half of that is true, it would be an unmitigated and lasting economic disaster. And Apple sitting at a 27 P/E ratio makes absolutely no sense under those circumstances.
Speaking of Apple, it is underperforming today and had a lot of resistance and/or push-back from its all-time highs. Not just during the regular sessions, but during the premarket. The longer Apple sits here, the more likely it is that we get a hard top here. And that would be pretty bad all around considering the fact that Apple could't get through these levels back in January. In fact, a lot hinges on Apple and tech. If we start to see tech roll over, the entire market will go with it. Today's rally has been fueled mostly by financials and consumer discretionary (again). Tech is nowhere to be found. So far each time Apple has pushed above $320, it has been met with a lot of resistance. Eventually it will roll over if it can't push through.
Finally, as our positions are concerned, here's where things stand at the moment. A 50% retracement from the $312 area puts the SPY at $265. That still creates a highly profitable trade from these levels. A 10% correction puts the Spy at $280 which makes the trade mildly profitable given the recent entries in the $15-$19.80 area.
Again, the key will be to trade around our position. The problem is the most recent move in the SPY makes that difficult. The SPY is simply up way too much now in such a contracted period of time which will make trading around the position difficult.
As Apple is concerned, we should see the stock fall to around $280 in a normal correction if it can't push through these highs. That should produce a pretty solid gain on our trade. So we're still in a position to make profits on these trades.
Admittedly it has been difficult to express just how insane and entirely abnormal this rally has been so far. And though the SPY did sustain a 36% correction, the size and speed of the rally is still abnormal even given those circumstances. Just to give a sense of how out of control this rally really is, take a look at this chart below. It shows each of the melt-up rallies over the last decade in the QE era. Notice that each of these periods represents an ENTIRE YEAR. Each of those brackets below are a full year. The most impressive move by far was the 2019-2020 rally which took a full year for the SPY to rally 48%. The SPY has done almost as much in just 2-months time. Notice that it took the SPY a year to put up a 48% rally after sustaining a 23% correction. 13-months to be exact. This time the SPY recovered in just 2.5 months:
And notice the key fundamental difference between 2018 and 2020 is that the SPY sustained a phony correction in 2018 to be honest. There was very little to no real economic impact from the trade war. It was minimal at best. Relative to the Covid Crisis, the trade war impact is non-existent. And even after that phony correction, it still took the SPY a full year to rally 48%.
Now we have a real hard-core economic impact, 20% unemployment, huge uncertainty on the job recovery front, huge uncertainty as to growth and yet somehow the market feels this environment warrants a more robust recovery than post-2018. A recovery that is 6x more robust than 2018.
What this chart also illustrates is that this move is unsustainable as is the overall trading environment we've been in over the past two years. The 2018 crash, the 2019-2020 recovery, the 2020 crash and now the 2020 revery. those huge swings cannot continue. The market is completely out of control from a volatility perspective. This is a huge departure from the 2010-2018 melt-up era.
The SPY cannot continue to put up 13% rallies every two weeks. Eventually everyone will run out of money at that pace. Notice that we're talking trillions of dollars in value added on a 40% rally and trillions in losses on a 40% crash. This isn't some mid-cap stock that can rally 40% in a few months without consequence. The S&P 500 as a whole moving up like this is problematic because there aren't enough buyers to sustain the market at these sky high levels. When profit taking ensues, there won't be enough buyers to even partially fill the orders. The S&P 500 has added nearly $7 trillion in market value since the March lows. Most of that can be attributed to Apple, Microsoft, Google, Amazon and Facebook (20% of the entire index). And those companies are becoming extremely overvalued at the moment as they sit at all-time highs. Apple is at a 27 P/E ratio, Microsoft is at a 35 P/E ratio, Google at 31, Amazon at 110 and Facebook at 31.5. Those are some pretty sky high P/E ratios. In fact, those P/E ratios represent the extreme high-end of the P/E ratio range for each of those companies. Those are the P/Es we see at market peaks.
Finally, consider this. There is no era in modern history where the S&P 500 has recovered at such a pace. None at all. In the 2008 financial crisis, the S&P 500 lost 56% of its value falling from 1520 down to 666 at the lows. That's a 56% loss.
After nearly 6-months of heavy volatility between October 2008 and March 2009, the S&P 500 began its robust recovery off the lows. It rallied 43% in FOUR MONTHS. But this after falling 56%. That 43% rally was then met with a 2-month long 10% correction from 950 down to 850 on the S&P. It went from 666 to 950 and then down to 850. Still, it took the market four full months to stage a 43% rally after falling 56% over the course of 7-months. The market fell 36% in 3-weeks and has rallied 43% in 2-months.
In the 1987 Crash, the market fell 37%. It took the market 1.5 years to rebound 43%. It began its recovery off the lows immediately, but the market required a 1.5 year time period to recovery. It took over 2-years for the market to get back to its highs.
Again, there is NO PERIOD in modern history that is remotely comparable to what we're seeing right now. It is unprecedented. The size and scope of the rally is more robust than at anything I've seen including the dot-com era. Speaking of that era, the S&P 500 did rally 53% in a short period of time driven by the tech rally. It rallied 53% in 10-months. But that was a hyper bullish period driven by the rise of the internet. What do we have here? A 20% unemployment outlook. Nothing really positive in the future. A recovery isn't a positive outlook. That doesn't warrant fresh all-time highs and a robust rally. That warrants a recovery over a prolonged period of time like in every other era.
For example, the S&P 500 fell 56% in 2008 due to the financial crisis. The fed injected liquidity into the market and it took almost a full 9-months just for the S&P 500 to recover back to 1,100 from 666. Granted that represented a 69% rally over a 9-months period of time. But we also had corrections in-between that period and the market was also down 56% from peak to trough. That would be the same as the S&P 500 falling from $337 down to $148 and then recovering to $251 9-months later. That would be the comparable situation. Instead, what we had was the S&P 500 falling from $337 down to $218 and then recovering to $312 in just 2.5 months! The point of this point is to illustrate just how unprecedented this move is and why it is very unlikely to be sustainable.
In the last 23 trading hours there have been almost no sellers whatsoever. We've only seen 5 mildly red hours and the rest have been hyper green. Now this cannot really be attributed to QE because the amount of money flowing into the market far far outstrips Fed buying. In fact, Fed open market operations are at their lowest levels since the crisis began. They're back to buying at levels seen before the crisis. All of the buying is all mostly over and that's why the market is up 43% in such a short period of time. But over the last few weeks, both POMO and REPO buying has gone back to pre-crisis levels. A few billing a day. That's not much and hence what we've seen over the last 10-days isn't really attributed to Fed injected liquidity.
So here's where we're at now. I'm starting to get extremely frustrated with this trade as the market simply isn't functioning normally. I simply don't understand this market. Fed liquidity isn't it. There's something else going on.
As a result, we might be forced to call it on the SPY puts trade. The SPY is very overbought and hence will likely see a sharp pull-back soon. The SPY might just as easily go up to all-time highs with the rest of the market. I'm now worried about preserving capital and just trading the next oversold trade.
It is far easier to trade off oversold conditions than off overbought conditions. The logic behind this trade was unassailable given everything we know about the market. V-recoveries are essentially non-existent or very rare....You just don't want to bet on a V-recovery as it's always more conservative to assume that there is some natural back & fill. When you get a crash of 36%, there's always a second leg lower. When unemployment skyrockets to 20% no matter the cause, the consequences reverberate. So putting on the short trade made sense and we wouldn't have done it any other way. But in the end, this isn't working. The SPY pushing through $312 -- the last line of resistance before all-time highs -- just skyrockets the risk for the trade. So once we get a pull-back from these overbought conditions, we will probably just call it and wait for a better set-up.
Eventually we were going to take a hit and it's been a pretty long streak of solid returns. It took an extremely irrational market to get us to a loss. Will update on the next pull-back.
LOOKING @ THE 2008 HEAD & SHOULDER TOP
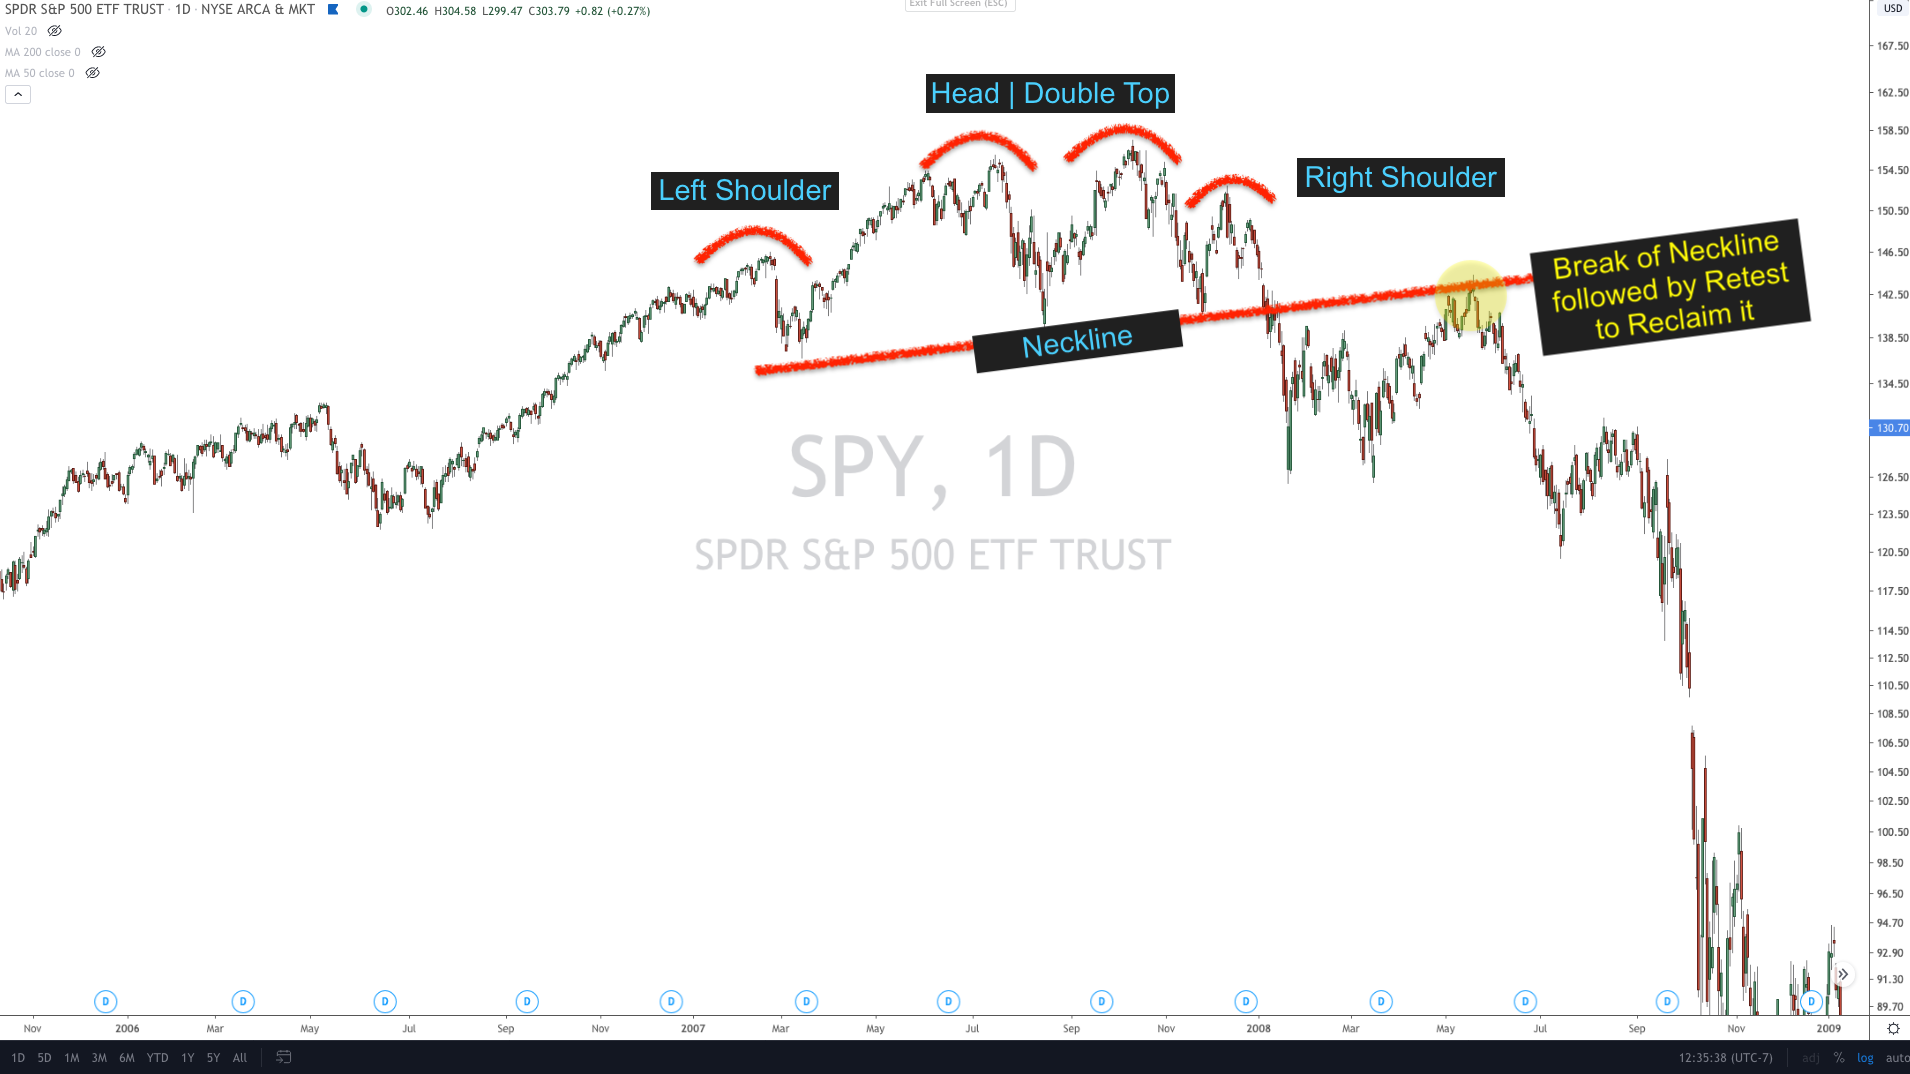
someone requested that I post the 2008 head & shoulders top that preceded the financial crisis. I remember recognizing this potential head & shoulders top on near-years 2008 in back and forth texts with close friend of mine. I didn't believe it then. The implications were significant. It ended up playing out. We're seeing something similar here but on a much much larger scale. So the 2008 head & shoulders top had multiple shoulders and spanned from $122 to $105 on the SPY. That might not seem like much, but that's a 14% head & shoulders top with a 14% downside target or -28% from peak to trough. So that's a pretty sizable head & shoulders top. They don't usual span that large. What's more, you're looking at a 1-year to 1.5-year developing pattern here. Here is the Head & Shoulder topping pattern during the financial crisis era:
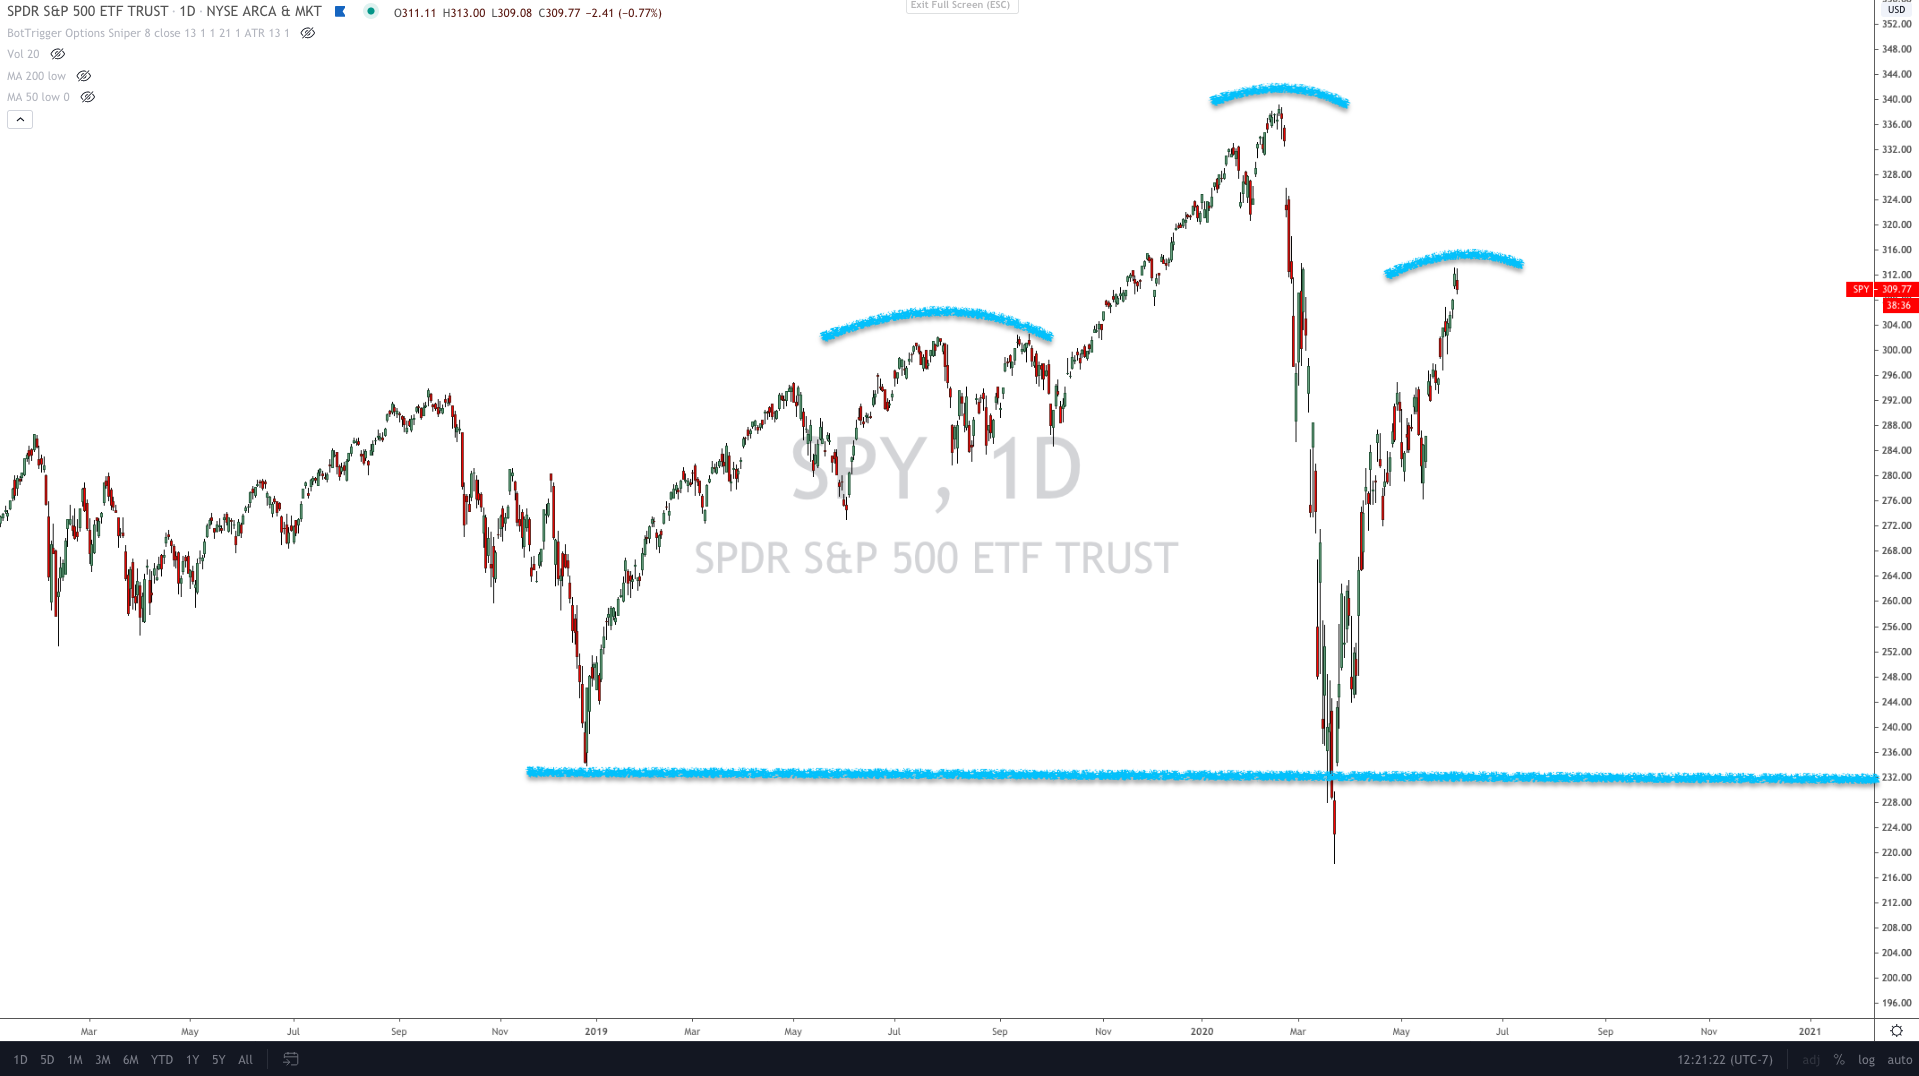
Now compare that to what we're seeing now. Notice that I didn't start to sound the alarm back in 2008 until we had already developed two left shoulders, a head and a right shoulder that developed in December 2008. That's what I was corncerned. We had already developed MOST of the pattern. I just thoughT the implications were so radical as to be unbelievable. IT was way way worse than the downside target suggested (-52% versus -28% target). Anyway, here's the current set-up. Again, we don't have a head & shoulders top unless we get another shoulder and neck-line. And even then, head & shoulders tops breakdown only 55% of the time. That's after fully developed. But when they do break, they're pretty much the most bearish patterns in the market:
The key with head & shoulders tops is that they need to have a fundamental driver behind them. It's usually a sign form the market that something isn't right. The key then is to find the fundamental driver behind the pattern. That wasn't so clear in 2008. I think here, we're seeing a lot of clear signs. First, we have the Covid pandemic which could very easily see a far worse 2nd wave and a high reluctance to do anything about it. I highly doubt the U.S. is going to choose to go into lockdown again and that could have disastrous consequences. Second, we have the economic impact of the shut-down. We don't know just how bad it's going to get as a result of those job losses. The 20% unemployment is going to have a last and significant impact to the economy. Even after we come off lockdown and rehiring begin. Even with that, many businesses will have suffered financial distress from which there is no coming back. At least they won't be whole. That will have a lasting impact on the economy and the market seems content to completely ignore that right now.
But a few months from now? We could very easily see a big shift in sentiment and then all of a sudden the market will focus on that issue. That could very easily lead to right shoulder and if the economy deterrers from there, we could easily see a breakdown.
The point is the technicals are telegraphing that potential outcome. It's only potential right onw. WE could just as easily see the SPY shoot right passed the head to make new highs and invalidate the pattern. Or the market can create two heads. If we see the SPY go to its highs, peak and then crash again. That's still a head & shoulders top set-up as long as it pushes back down to the neck-line.
But these are long-term outlooks and doesn't really pertain to our current trade. We're in this trade for the eventual retracement of this 40% S&P 500 rally we've seen in just two months time. Even assuming a full blown recovery of the economy, that is too far too fast. Bear markets don't last 3 weeks and then takes 9 weeks to recover. That has never happened. Even after the 2018 correction where the SPY went on to full v-recovery took 5-6 months to get back to its highs. Not 9-weeks.
Thus, the focus of our trade is retracement. Not the potential head & shoulders top developing. That's more for information purposes. If it develops, we'll trade on it.


Comments