
MARKET OUTLOOK : New All Time Highs En Route
- Momentum Stock Alerts
- Oct 13, 2019
- 5 min read

We're going to layout the evidence for why this market is more likely to eclipse it's all time new highs than rollover like many permabears would like to see otherwise. We'll cover the bear case as well, but as of now the benefit of the doubt continues to go to the buyers of this market. Lets look @ the $SPY
BULLISH EVIDENCE:
1) Placement of Friday's Gravestone Doji is actually more bullish than bearish given it's location within the larger pattern, as it occurred near the bottom range of a volatility congestion zone off the back of a very strong gap-up
2) SPY & all the major indices are showing bullish confluence with RSI breakout + stochastics & MACD bullish crossovers occurring (or about to curl bullish) on the daily.
3) Price now above a 2-month long volatility zone aka Darvas box
Placement of Friday's Gravestone Doji is actually more bullish than bearish given it's location within the larger pattern, as it occurred near the bottom range within this most recent pullback cycle.

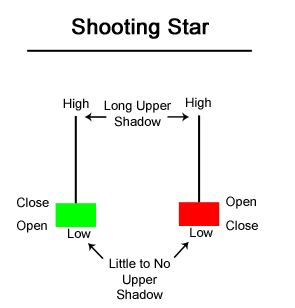
Last Friday the market had a breathtaking gap-up that departed the volatility zone pretty much across all the major indices. Notably on the SPY, price gaped-up from Thursday's close of $293.24 to Friday's opening price of $296.27....bulls then ran the ball to a high of $298.74...all seemed really bullish until the bears ran price all the way back down to near the open, closing the day @ $296.25. That entire move is a text book reversal candle bar known as a Gravestone Doji or it's very similar cousin also known as a Shooting Star.
Given the hard reversal that occurs within that candle bar, they are known to be bearish reversal bars that tend to indicate a larger pullback is coming. Again: open low, run high, then close back down to the opening price of the bar is known as a gravestone doji or shooting star.


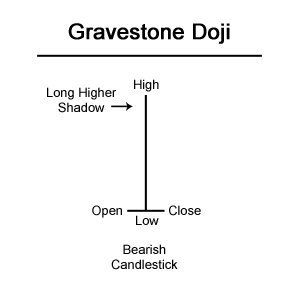
However they are very easy to misinterpret. The most important factor to consider when discerning the relative weighting of a gravestone doji is PLACEMENT. In other words, where does this reversal bar occur within the larger scope of the trend. When we see a flying doji @or near the peak of an uptrend, then yes, they tend to signal that selling pressure is increasing as profits are being procured ...and an imminent pullback cycle tends to follow. However if we see a gravestone doji, or shooting star, occur near the bottom range of a pullback cycle then they tend to actually signal more indecision than anything else...and the resulting reaction tends to more often be associated with a snap-back reversion to the mean type of play; which again, when occurring at the bottom range of a pullback cycle they tend to signal a more bullish move is coming.
This recent gravestone doji has a more bullish tone to it than bearish. And although yes a pullback may ensue for a few days, the more important indication is acknowledge that it's very placement has occurred near the bottom range of a volatility zone after a very strong gap-up.
The $SPY & all the major indices are showing bullish confluence with RSI breakout + stochastics & MACD bullish crossovers occurring (or about to curl bullish) on the daily.

On this daily chart above of the $SPY, take notice of what tends to happen when RSI breaks out above a resistance trend line or above resistance = what we see is price action confer with the RSI breakout. Stack a bullish crossover on both MACD & Stochastics and we have a bullish storm setup on the horizon.
Give me 1 bullish indicator, good
Give me 2 bullish indicators, better
Give me 3 bullish indicators, even better and so on.
Price now above a 2-month long volatility zone aka Darvas box

Take a moment to really acknowledge that the stock market has been in a chaotic whiplash of volatility over the last 2 months. Let's isolate what that volatility period really looked like as highlighted in the blue box above. We have now cleared above that volatility range for the 2nd time and are very likely now on the 3rd retest of the highs. Double tops are very common, but triple tops are as rare as bearded pokemons. Usually the 3rd retest of any low/high tends to thin out the supply of shares in said resistance/support...and that's why they tend to breakout/down on the 3rd retest.
Note* This is not the law of the land as nothing is guaranteed in the market...but this occurrence of breaking out/down on the 3rd retest of the highs/lows is more akin to market axioms that tend to play out more often than not. But even as they tend to play out most participants experience diminished moxie to withstand holding ground through the move. This very nature is also what causes said breakout/down: It's the I can't take it anymore! UNCLE or FOMO nature that only adds fuel to the outcome. Uncle & Fomo aside, market economics alone indicate that with each retest of the highs/lows there is share supply being thinned out.
For example, buyers were not strong enough on the first push higher because sellers were too strong...price pulls back and builds new energy/momentum to retest the highs for the 2nd time.... on the 2nd time buyers maybe made equal highs or incremental new highs but yet again were not strong enough to counter the selling pressure. But on this 2nd push they have already collected more shares as they take shares with each push. Now on the 3rd push they encounter even less sellers since they have transacted supply & fulfilled sellers desire to sell on the 1st & 2nd push. So there is a tipping point where once the buyers are more in control ...they will be able to dangle the asking price (ask dangling the carrot) at higher prices.
Bearish Concern: Near-term we fill the downside gaps

Bearish near-term possibility is that we fill these 2 gaps that are currently around the $296-$293 area & then there is another gap from $291.75 - $288.50 area. Gaps often get filled but there are many times where they do not. NOT ALL GAPS NEED TO BE FILLED.
There is a classic market saying: The market fools most of the people most of the time. Right now it's a little too obvious that the market would fool everyone who has been seeing these gaps get filled and now they want to show up @ the table uber confident placing their bets on how this gets resolved. Fools theory aside, when we stack all the evidence above I'm just not convinced this gap needs to get filled. Could/might get filled, sure. Just be aware that even if we fill the first gap, we would still be within the vicinity of higher lows on the larger trend. If we fill that gap however it does setup even more possibility for the market to fill the 2nd gap. Admittedly if we fill this 2nd gap, the market is going to feel really beat down which may cause further selling pressure to the mid 270s. So the market sentiment going through those pullbacks would be of concern. But let's just take this one day at a time for now. If we fill those 2 gaps then we will reassess the setup & model accordingly.
We want to stack the odds in our favor when distinguishing the probability for an intended outcome. Right now the SPY is giving us plenty of indication to be/get long. We'll start reducing longs once we get near oversold levels on RSI, MACD, Stochastics etc but for now we want to milk this next move higher. Until then, we patiently wait for the setup to play out.
The U.S. central bank said Friday it will purchase $60 billion of short-term Treasury debt each month in an effort to ward off stress in overnight lending markets. https://www.marketwatch.com/story/fed-plan-to-buy-t-bills-may-open-door-to-more-stimulus-2019-10-11


Comments