
Setting Up to Retest Lows $SPY
- Momentum Stock Alerts
- Apr 22, 2020
- 9 min read

Updated: Apr 27, 2020
Updated - April 27, 2020
The SPY is forming bearish divergence here on this 2-hour time frame where we have price making equal to higher highs while RSI has been making lower highs. That's a key signal that up energy is waning. We're seeing this also on the daily time frame, it's just more easily to distinguish here on this 2-hour.
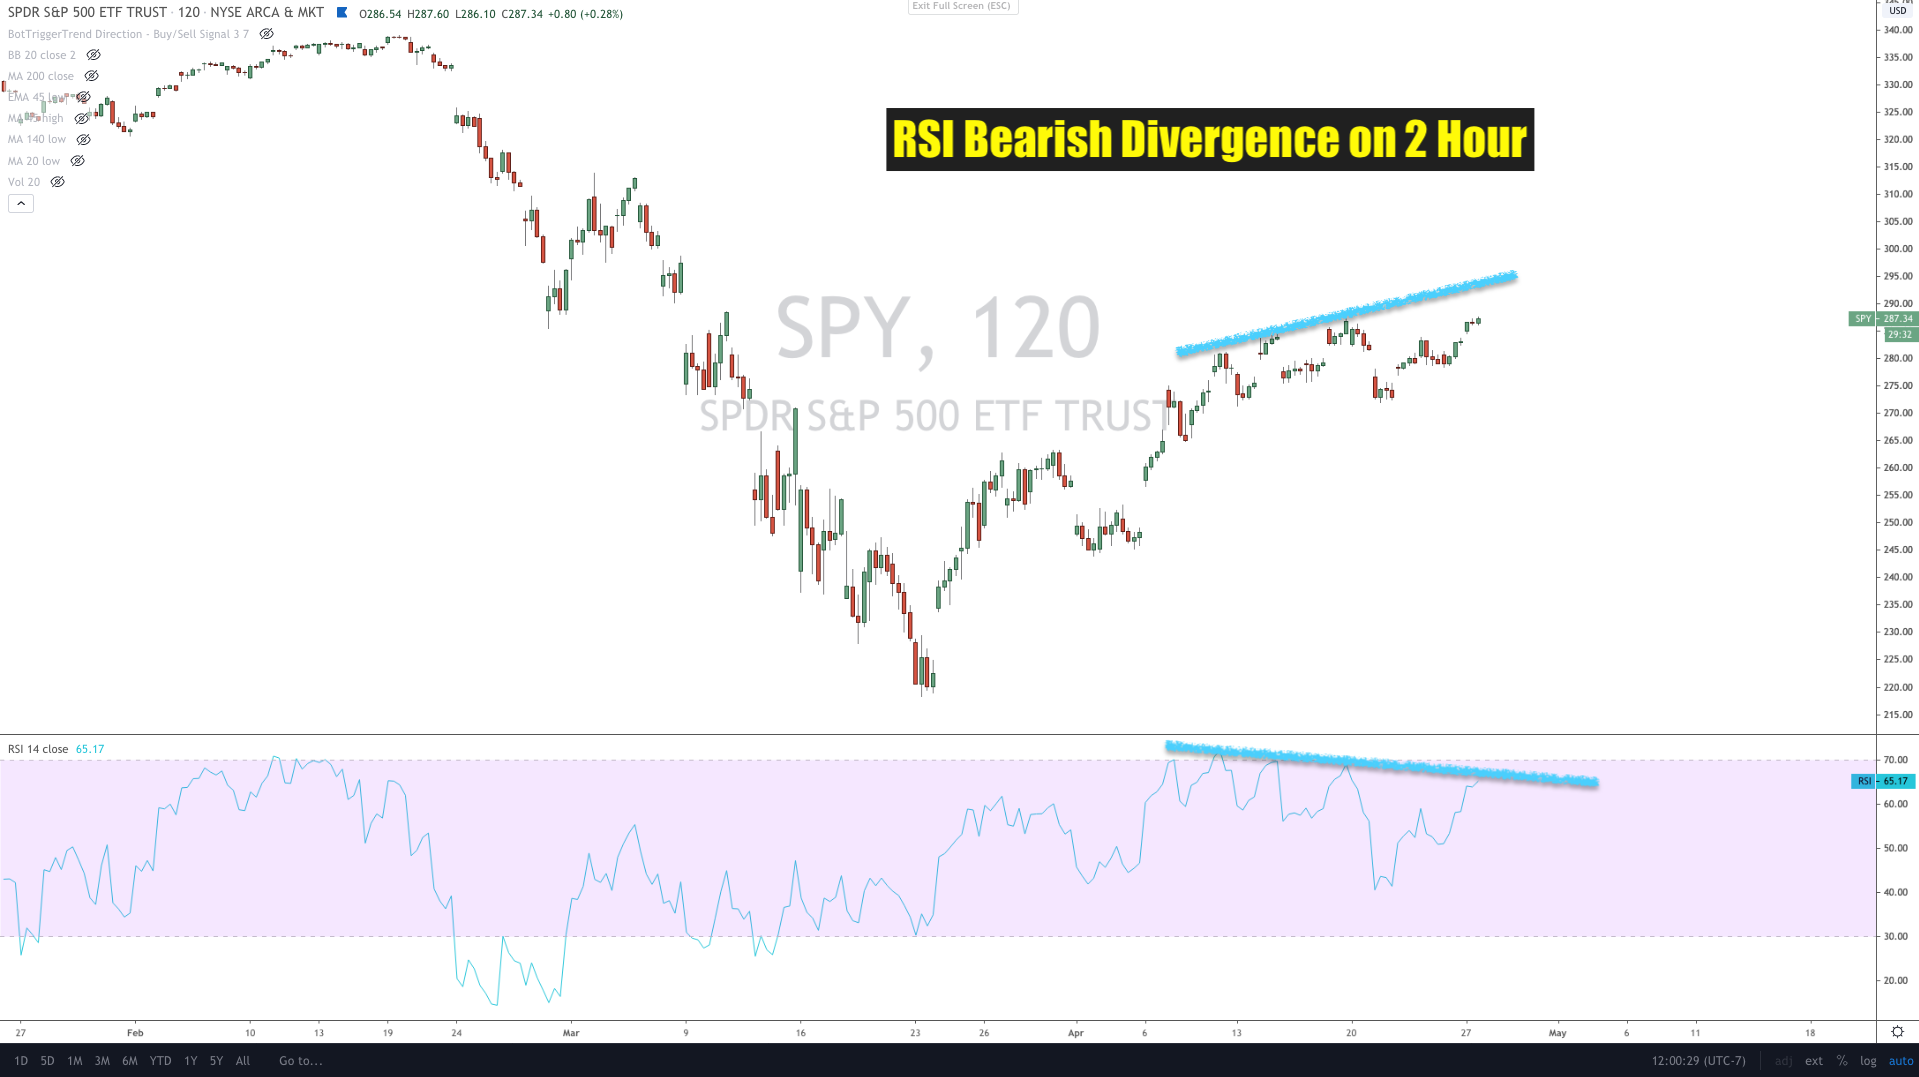
So the SPY is back to retesting its highs of the rally. We'll have to wait and see how this plays out. It's unclear whether the SPY will break those highs or whether we will get a peak here. What we do know is there is a massive disconnect between the stock market and economic reality. In fact, this is the biggest disconnect I've ever seen as the market is concerned. We've seen huge disconnects with Apple before both on the upside and downside -- the biggest of which was 2012 when Apple reported 110% earnings growth and crash 45% to a sub-10 P/E ratio w/ 65% of its cash representing its market cap. So we've seen huge disconnects before. Just not when it comes to the S&P 500 as a whole.
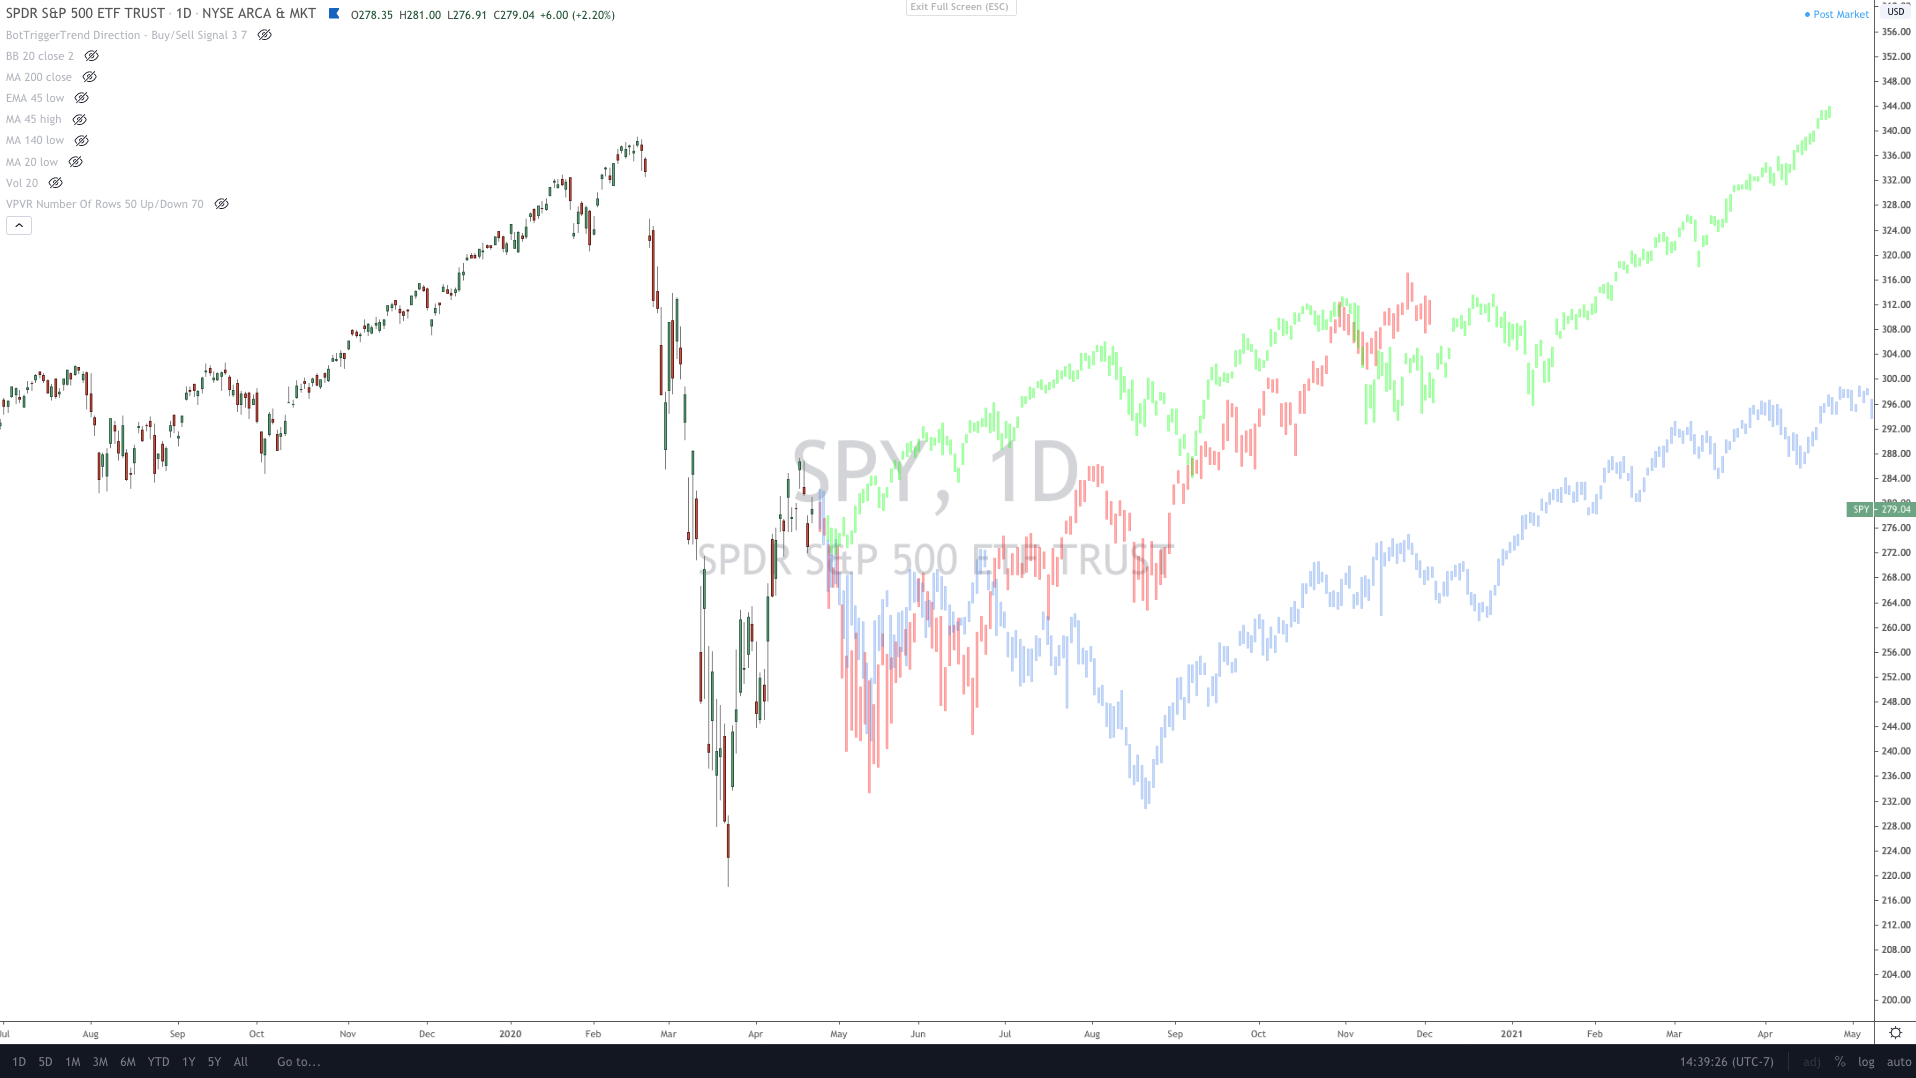
But we have seen something like this before in 2008. Remember, in 2008, we had a crash in January, consolidation in February, bottom in March and a rally that took the market almost all the way back to its highs by May. Then it saw a slow grind lower from May to August and finally a second huge crash in September - October 2008. So this could very well be a repeat.
Again, we are in January options. We might revisit our risk parameters as I do believe there's an extremely high probability that regardless of whatever the market does here near-term, it's going back to its lows, crashing again, or at the very least create a HIGHER LOW setup. The January $275 puts are perfectly good long-term options because that price represents a level that is 27% above the SPY lows. So chances are those options will be deep in the money at some point in time between now and January. So we might move up our stop loss to $300 or we may reduce down our position size and just hold it. So if we reduce down to 10%, we could hold for a longer time. What I don't want to see happen is we sell at $290, the SPY peaks at $296 and then it crashes down to $200 on the obvious second wave of Covid-19 hits. It will be stupidest fumble ever because we know right now what is very likely to happen here. The only thing that shakes confidence is the market's performance which has no connection whatsoever to economic reality. Even if the virus disappeared off the face of the planet today, the damage is already done. There are long-term impacts here.
So at $290, we may opt to sell a portion of our position to reduce risk and continue to hold a good chunk of our position.
Original Post - April 22, 2020
We now have a potential Island Reversal setup on the peak range of what we believe will be a near to intermediate term top:

Keep in mind that this pullback that we're expecting can happen with one of the 3 primary ways here which is:
→ Double bottom "W" like recovery where we get a retest of the lows
→ Higher Low setup
→ Deeper Low setup
So if pullback from here that's what we're expecting & our plan will be to get ready to give the benefit of the doubt to the buyers for the larger primary term trend ... but we will be modeling those trades with the possibility that we could actually be in a longer bearish market giving us the ability to get out of long positions unscathed if we were indeed in a full blown bearish period similar to what occurred during the financial crisis period.
Here are some scenarios that we'll be modeling our next round of long call spread opportunities for, primarily the red & blue highlighted scenarios:
I don't anticipate the green scenario @ this time & it is the green highlighted scenario that would admittedly make our entry on certain longs difficult to acquire. We'd have to model much more conservatively if the market took the path of the green, whereas if we see something more in line with the blue & red highlights we'd be able to afford taking on more risk & targeting higher yielding call spread opportunities.
Again, so although we are bearish on the near to intermediate term, we are going to be assuming that the larger secular bull market may still be viable. But we don't BULL here in this area. Not a chance. We'll wait for lower before we'd be willing to risk a net heavy long folio here around this area.
With regards, to today's session, there's not a whole lot more to say today as nothing has really changed from yesterday. The action we're currently seeing in the market is clearly bearish tilting. Even with today's rebound. It suggests that the SPY is still mostly in a consolidation phase which is bearish. This is now the 9th session of consolidation. Now the reason this is bearish is due to the NvN momentum rule. The NvN rule for v-recoveries is basically this. The number of days/bars on a chart that it takes for a stock/market to recover after a sell-off should roughly equal the number of days/bars it took for the stock/market to bottom. So for example, if it took 10-days for the Dow to lose 10,000 points, a full v-recovery would require the Dow to recover in the ensuing 10-days or close to it. The more robust the recovery, the more v-shaped the recovery. The less robust the recovery, the more of a check-mark shape you get which is essentially a big bear flag. That's what the NvN rule basically illustrates. When the recovery is A LOT weaker than the preceding sell-off, it literally means the recovery is a bear flag and more likely to ultimately breakdown. Look at 2018 for example. We had a robust v-recovery in 2018. The SPY took 16 days to go from $272 down to $228. It then took the SPY only 37 days to fully recover. Now let's compare to today. The SPY took 22-days (3-weeks) to go from $337.10 down to $218.26. In the ensuing 22-days (today oddly enough), the SPY went from $218.26 to $278.85. It has basically only recovered HALF of the losses sustained over the same period of time. That's not very robust. Now while it's true that in 2018 it took more than double the time for the SPY to completely recover – which is about the same pace we're seeing now – we have one huge difference. In 2018, the SPY recovery was actually very robust at the beginning and then slowed down as it near the highs. Most of the lag to fully recovery was near the highs. Also, a huge difference in 2018 is we never saw a 9-day consolidation like we saw here. The SPY had a 6-day consolidation after it had recovered roughly 70% of the losses and then continued on its way. If you take a look at the chart below, you can see that the SPY did a straight non-stop shot right up to $260.49 in just 17-days. The peak was $272. The SPY fell from $272 down to $228.08 in 16-days. It then took the SPY only 17-days to almost fully recovery. It stoped a mere 10-points below its highs. It only consisted after breaching way above the 62% retracement:
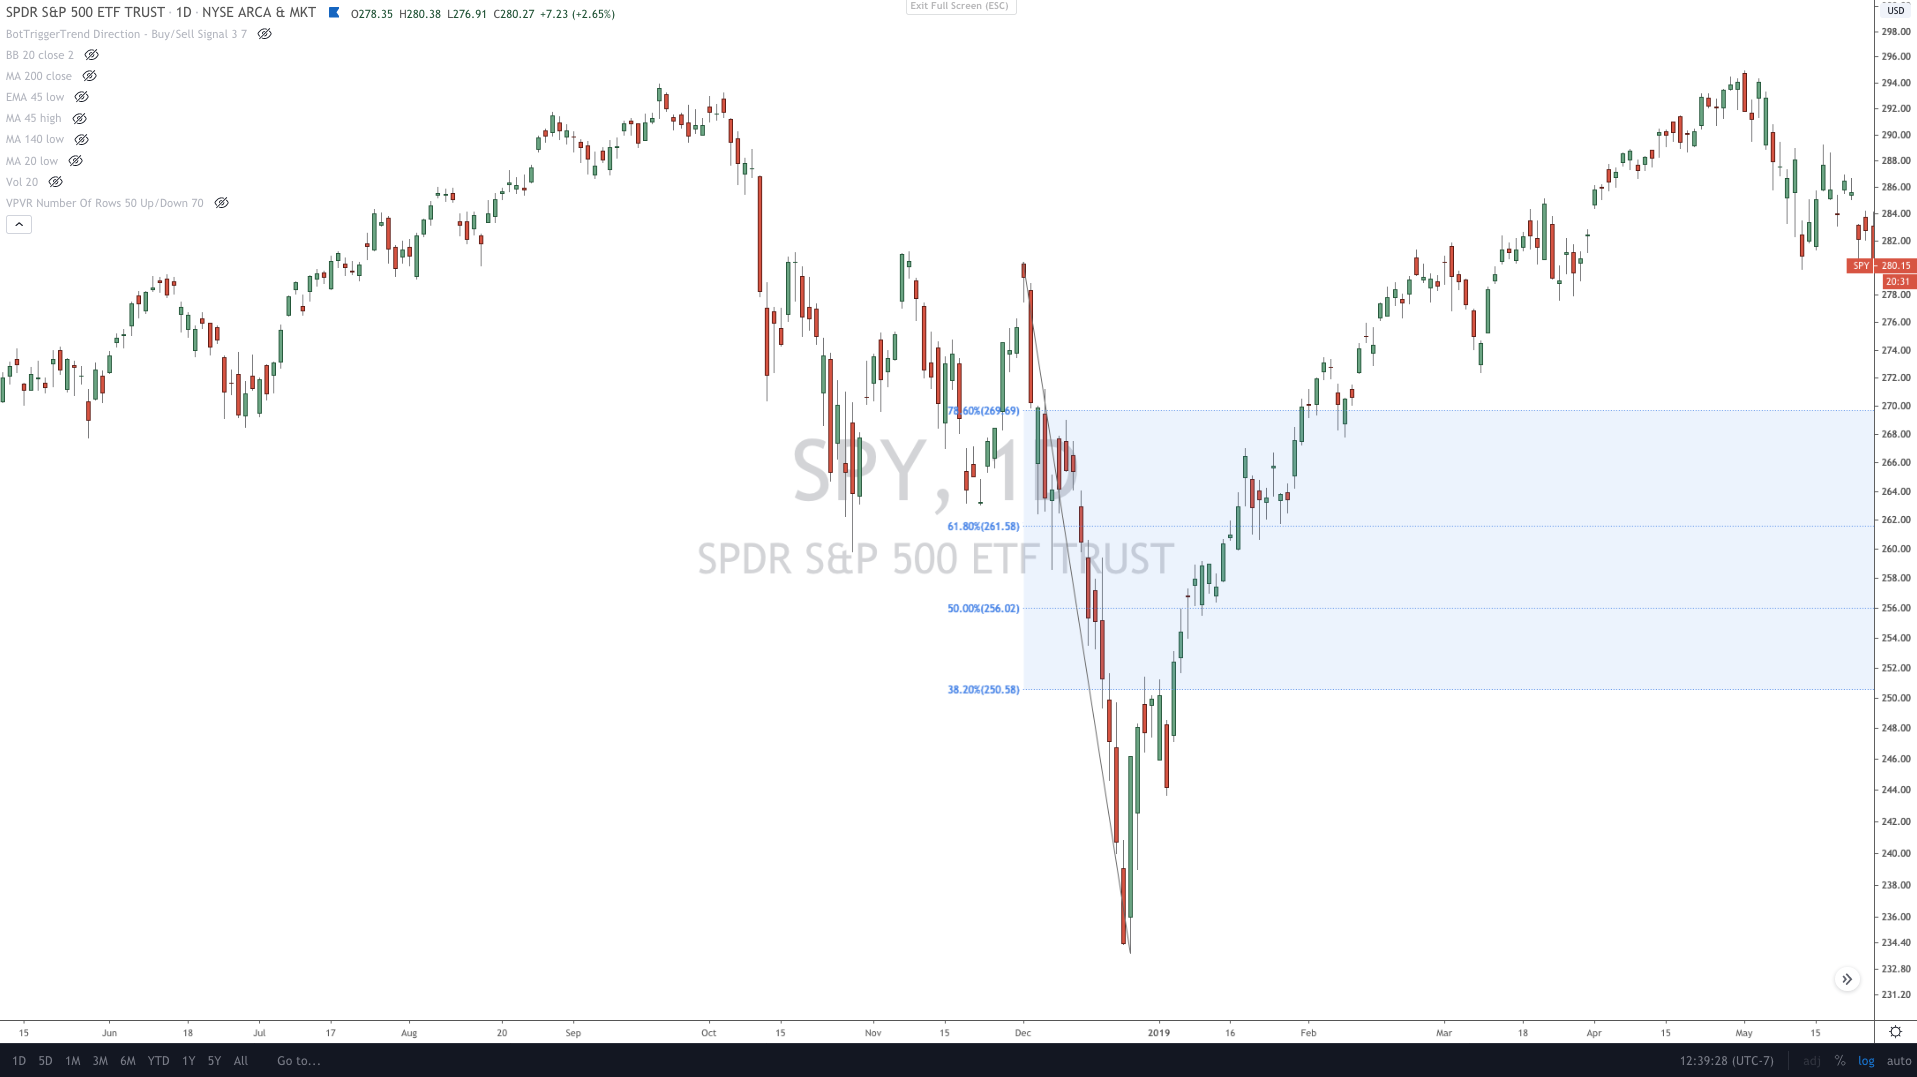
The point here is this. While it took another 20-days for the SPY to go from $260.49 to $272 (full recovery), it recovered almost all of the losses in roughly the same number of days it took to for the SPY to bottom. It was 16-days from $272 down to $228 and only 17-days from $228 up to $260.49. That's a pretty solid v-shaped recovery. Now let's compare to today. In today's rebound, the SPY has only managed to recover just a tad bit above 50% of the losses. Technically speaking, since the SPY is sitting at the 50% retracement right now, it is 22-days to recover 50%. As a result, what we get is a more check-mark shaped recovery unlike the sharp v-shape we had in 2018. See below:
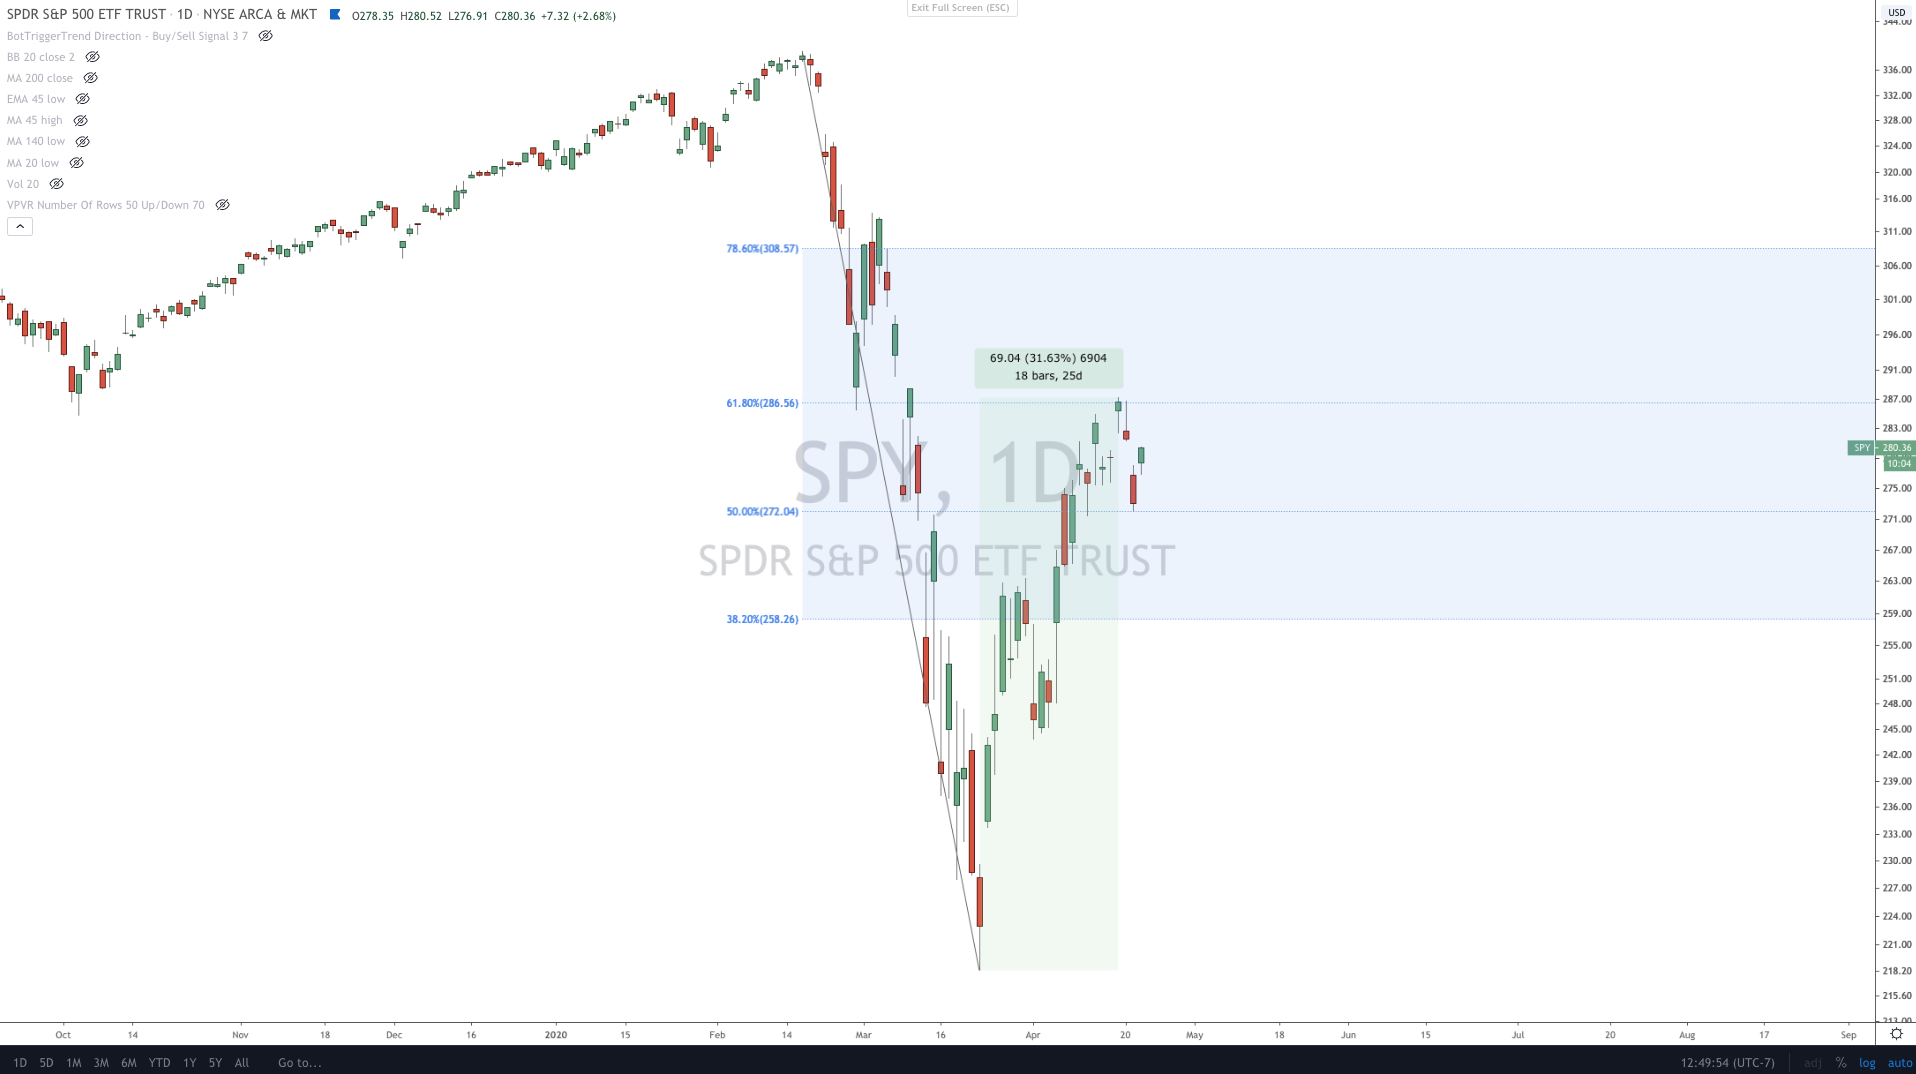
When the SPY first hit $281.20 on April 9, the recovery started to look pretty v-shaped. It looked like the SPY was on its way to a full-blown extremely irrational v-recovery. But in the eight (8) days that followed since then, things really started to take a more bearish tilt. We didn't really see much come out from the Gilead news which is pretty surprising. The market was on cloud 9 in after-hours when that news hit. It tells me that the market might be coming back down to earth. The same goes with Apple. Apple was trading as high as $296 in after-hours that day. It's now sitting here at $275.57. That's 20-points below where it was trading in after-hours on the Gilead news. Now the obvious reason why there should not be a v-shaped recovery even if Covid-19 mysteriously disappeared today, is that there is still the lagging economic impact and uncertainty to deal with. We don't know how bad the economic really is. That's because there's going to be a lag effect. We won't get the impact for another quarter or two. Remember, at least 1/3 of this quarter for Apple had no Covid impact whatsoever. When Apple delivered guidance in late January, it was based on the information they had at the time which was a full month of "business as usual." So part of quarter is already tainted with "good data" so to speak. What's more, when Apple was sitting at $327 it was already extremely overvalued. Remember, Apple's P/E ratio expands and contracts on a 3-year cycle based on the iPhone upgrade cycle. We've seen this repeatedly since the iPhone was first released in 2007. We saw it to a lesser extent in 2010-2011 when Apple underperformed the market for a year. While Apple didn't have a bear market like it has in more recent cycles, the point is that this cycle is evidence as far back as 2010. The cycle has generally put Apple at between a 10 and 18 P/E ratio. A 10 P/E in the most bearish of circumstances (at the lows of a bear market) and at an 18 P/E ratio at the peak of bullishness. Due to 2018's v-shaped recovery – which made no sense at all – Apple's P/E ratio rapidly expanded earlier than expected. When Apple fell 40% in 2018, what should have happen is Apple should have partially recovered and then had 2 or 3 more legs down. Either that, or it should traded sideways like we saw in 2015-2016. The point is that the Apple bear market lasted only like 4-5 weeks total. This caused the P/E ratio to rapidly expand. What causes the contraction in the P/E ratio is the element of time. As Apple reports higher earnings and as the stock trades sideways, that P/E ratio contracts. But when Apple crashed and then almost fully recovered in the same goddamn quarter like it has mostly done here, the P/E ratio never has time to contract. IF Apple simply goes back to its highs here, the P/E ratio will be even higher due to contracting earnings from Covid-19. Apple's P/E ratio sits at 22 today which would have been well beyond the peaks we saw in every previous cycle going back to 2012. For example, in 2012 when Apple hit $705 a share, it's P/E ratio was only 18. In 2015, when Apple hit $135, its P/E ratio was right around 18 again. Now even though Apple is down 16% from its highs, it's P/E ratio is at 22. That makes no sense at all when one considers the fact that Apple's iPhone growth rate has completely peaked as has Apple's revenue and earnings. Apple is simply overvalued for the time. Should Apple hit $400 a share? Yes. But just not right now. It's an issue of time. That's all. Look in 2008, Apple was worth $1 trillion -- 10-years from then. But that doesn't mean it was worth $1 trillion in 2008. So right now it's an issue of overvalued for the time. Now the SPY is also in the same exact place. It makes no sense for the SPY to fully recover because it was already pushing overvalued when it had reached its peak to begin with. This is without Covid-19 and without the accompanying economic impact. The point is that when the SPY was sitting at $327, it was based on a different set of future expectations. Expectations that we are nowhere even remotely close to achieving. The SPY $327 valuation was based on set of earnings outlook and now we have a completely different set that is way below those expectations. So why would it make any sense whatsoever for the SPY to fully recover this quickly? Like I said, even if Covid-19 disappeared, it makes no sense for the SPY to trade back up to $327 so quickly. In 2018, what brought the market down 20% was the China-Trade War. But that impact wasn't clear at all. A v-recovery made a great deal of sense because the economic impact wasn't all that big to be perfectly honest. The market made a big deal over nothing. Yeah there was an impact. But no 20% off the market impact. Apple falling 40%? That made no sense at all. So a v-recovery in 2018 makes some sense in that the underlying cause wasn't a huge issue to begin with. But Covid-19 and the 18 million job losses in 3-weeks? That's a huge deal. That's real. So for now, we feel confident in our position. And what we're seeing now is ultimately going to hurt more than help the market. Again, the 9-days of consolidation is bearish tilting when considering the NvN momentum rule.


Comments