
AAPL'S MACRO BULL & BEAR CYCLES - Bear Raid likely to Start Mid 2018 (Q2-Q3)
- Momentum Stock Alerts
- Mar 17, 2018
- 14 min read

Updated: Jul 10, 2019
UPDATED - AUGUST 2, 2018 - THURSDAY
Our position on Apple hasn't changed one bit. For the last 8-months I've pointed out that Apple is now trading at the high end of its P/E ratio range and that it's in the later innings of its bull run. It's certainly significantly closer to the end of the bull run than to the beginning. We've seen a cycle with Apple where it will push close to a 20 P/E ratio, trade at that high P/E ratio for several months, peak and then enter a bear market. It will then trade near a 9-11 P/E ratio for a period of time ranging from 6-12 months, bottom and then begin a new rally. With Apple so close to $200 a share and a $1 trillion market cap, even when Apple was at $180 we felt there was a strong probability that Apple would eventually test that $200/$1 trillion market cap level.
But now that Apple is at this level, one has to consider the very limited upside. First, it's important to note that Apple has never reached its 1-year average analyst price-target this late in a bull market. Normally what happens is you get analysts which constantly raise their targets until that target becomes way too out of range for Apple to reach, Apple peaks and then enters a bear market. In 2012 that average target was $960. In 2015, it was north of $150. Today its $203. Think about that. Apple has reached its price target for once. Never seen that happen in a bull run. It will happen at the beginning of a bull run as Apple surpasses the ultra bearish downgraded targets. Those targets are then raised out of range. We're now more than two years into this bull run -- started in June 2016 -- and Apple is reaching its price-targets. That should be an indication at how overpriced the stock currently is.
Second, the biggest hurdle that Apple will now face as it has reached that all-important $1 trillion market cap level is the clear lack of investment opportunity. For Apple to climb 50%, it would have to add a FULL FACEBOOK sized market cap to the already $1 trillion value. Think about how absurd that is.
Even just adding 20% is $200 billion. There are only a small handful of companies that are north of $200 billion. And that is what Apple would have to add to its $1 trillion market cap to rise 20%. So where is the opportunity?
Third, Apple's price-to-sales ratio is now extremely high relative to the S&P 500. Right now, the S&P 500 is sitting at an 18-year high price-to-sales ratio of 2.24. That's an 18-year high. The reason the S&P 500 has a higher P/E ratio than Apple is because its price-to-sales ratio is relative low. The reason a very high price-to-sales ratio is negative is because margins can easily compress which can lead to a rapid increase in the P/E ratio. The reason Amazon was allowed to trade north of a 2000 P/E ratio for so long was because it traded at a 2-1 price-to-sales ratio. Apple's price-to-sales ratio is now pushing above 4.
Fourth, Apple's cash no longer makes up any significant portion of its market cap as it did when the stock was trading at $90 a share. Apple has added $600 billion in market value in 2-years. That's all premium.
But really, the biggest issue I see is the lack of investment opportunity. It doesn't make a whole lot of sense to be long Apple anymore just like it didn't make a lot of sense to be short the stock or to be selling the stock at $90 a share when its cash made up 40% of its market cap.
So we still very much believe that Apple is getting closer to a peak and gearing up to enter a new bear market. These things can happen at any time. It could start tomorrow. And speaking of the near-term, Apple now has two massive gaps to fill. Not gaps that are sitting at the begging of a bull market like we saw back in April 2014. No. These are gaps that are within 15% of the stock's current price. Apple has a $6.00 gap from $168 to $174 and now a $7 gap from $190 up to $197. Those are two huge gaps with 16% of the stock's current levels. That's $13 in big gaps alone.
In fact, I think the intermediate-term is going to be sort of bearish for Apple and I'm already considering putting on a hedged short trade. Here's why. The Apple volatility index has absolutely crashed down today (-32%) and the price to hedge an Apple short trade is EXTREMELY reasonable. Both the short side and long side of the trade are extremely attractive.
I'm eyeing the $200 - $190 November put-spread hedged by the $202.50 September 6 Calls. That's mostly because I think the intermediate term is going to be explosive and the Apple volatility index isn't pricing that in. I'll keep you all posted.
Now here is what blows my freaking mind completely. I really don't understand how the market can just give us this huge of a layup. The NOVEMBER $200 - $190 put-spread is trading at $2.70. I can't even begin to explain why this is so severely undervalued. But here's one thing I do know. That put-spread will hold up well against all bombardment in the volatile index. That's because those puts expire after Q4 earnings are related. That means they will hold an earnings premium. It makes no f'ing sense that this put-spread with that long of an expiration should only trade at $2.70. They should be north of $3.00 without anyone question whatsoever. This position can withstand a lot of sideways trading and even upside in the stock. That spread is undervalued. We're going to put on this trade.
UPDATED - JULY 31, 2018 - TUESDAY

BotTrigger Trade Alert: $AAPL Bought the June 2019 $200 / $190 VERTICAL PUT SPREAD @ $5.13 with a 5% allocation. We're going to start our exposure process right before earnings with the intent to add exposure one earnings gives us more color & confirmation on direction. For now, this June 2018 Put Spread will give us plenty of time to correct the trade in the event that AAPL heads north with authority.
MAX GAIN = 95% Gain so long as AAPL closes @ or less than $190 by June 2019
BREAKEVEN = AAPL @ $195.13 upon expiration
MAX LOSS = AAPL @ $200 or higher *UPON* expiration
This is a starting position that's relatively conservative as it expires in 325 days and is in line with the most base line expectation of our bearish thesis on AAPL which is: there isn't really a whole lot more upside on AAPL here around the $190 to $200 area. Instead of playing a directional short trade, this specific trade is simply intended to capitalize off the very high probability that AAPL's upside would be temporarily capped. If AAPL simply closes below $190 then the trade stands to make the entire 95% gain. Yet, we may sell this far before holding it till expiration. In fact, we do intend to put on a trade that will capture directional momentum once earnings is behind us and an obvious direction materializes.
The main reason why we're starting the short trade now is due to the RSI values on this monthly chart. Take notice that RSI is under the 70 value line and has been traversing below it for months now. This is very indicative of a loss of momentum and has historically been associated with intermediate term tops on AAPL
AAPL has had a tremendous +105% run since the bottom of 2016 where it hit a low of $89.47. This March we saw more all-time-highs as AAPL got as high as $183.50. We had a measured-move, breakout target on AAPL to hit $179.61 and that target was indeed fulfilled. Anyone can calculate the measured move target on a breakout pattern. They are to be distinguished as ranges or zones of gravitation...in other words, they are not exact targets, but more often than not are right within the range of the calculated measured-move. Don't underestimate their utility as they repeatedly play out to the extent that they're referred to as "textbook" targets. To calculate the measured move you simply take the high value of the last pivot high and subtract it from the most recent pivot low. You take that value and then add it on top of that last pivot high. See below:

Now that the target has been hit doesn't by any stretch of the imagination mean that there is no more upside. Quite the contrary, they can easily overshoot and inevitably do setup to do so. However sometimes they just hit the bullseye and the self fulfilling prophecy of everyone seeing the same target tends to hit sell orders as the easy money target has already been made. Remember on Overstock's chart we had a measured move target of $90...OSTK hit $89.80 to a T and then has since reversed course now trading around the $45 area.
In AAPL's particular case, we're going to layout the evidence for why we believe AAPL is nearing closer towards the tail end of it's MACRO bull cycle and is very likely about to begin its next major pullback cycle some time by end of April Q2 earnings to Q3 earnings near the end of July. It's all together possible that the larger pullback has already started on AAPL. But we need further confirmation before initiating the big short. We'll explain all of this & why.
NOTE: This post is not to be confused with our current AAPL short trade which is designed to capture near-term downwards momentum. We will address our current AAPL short trade in a separate post. This post is to get us ready for the macro pattern that is cultivating cause for a reversal on the macro time frame. AAPL is without question in an uptrend on the primary term trend, but along the uptrend, it's not uncommon to see AAPL pullback 30% to 40% when seasonality hits the stock. We plan on capitalizing on that next downtrend.
First off, before this post summons tribalists & pitchforks, let me remind you that BotTrigger spent the majority of its content focused on Apple's bullish setup back since summer of 2016 when we were getting Members ready for the monster run that has since came. We were long in several areas with buy alerts as low as $96, $104, $108, & $119 in a variety of long positions: common stock, call options & call spreads. Our APPL trades, to date, have been among our highest returning gainers on a weight-adjusted basis. We believe in APPL and are continuously charmed by the technical & fundamental might of this extraordinary company. But let's also distinguish a very key part of the Apple narrative: AAPL's share price goes through macro bull cycles followed by macro bear cycles.
Apple is handedly the most popular wall street darling of all stocks. And for good reason, with over $285.1 billion in cash on hand as reported in the quarter ended this last December. AAPL is the epitome of a sound money investment that continues to break per annum gross revenue records consistently more than any other. This is the company that changed the game showing that all this can be done while wearing tennis shoes and jeans on stage. The tribe mentality and massive cult following has unfortunately made AAPL an easy target for cyclical bear raids. AAPL is a very profitable asset class for market makers to sell market instruments such as calls & puts on. Their key target are usually the tribalist Aaaplonians on this stock who think that AAPL will just always go up. This makes AAPL very susceptible to both short term & even intermediate term bull & bear cycles. Fortunately, we can start to see when a macro directional change is about to occur on AAPL.
FUNDAMENTAL & TECHNICAL REASONS CAUSE THE PULLBACK
Although we're going to largely cover the technical evidence from a chart TA perspective, keep in mind while going through this that the cyclical seasonality behind what largely drives AAPL's direction has to do with it's biannual release of Apple's iPhone new form factor phone relative to the "S" iPhone. The largest bearish periods happened AFTER the release of the new form factor phone. Why? Because the YOY (year over year) comps for Apple are known to be near impossible for AAPL to beat on a YOY basis when they release the updated "S" version of last year's new-form-factor iPhone. For example, this last Christmas we had the iPhone X which was Apple's new-form-factor iPhone, entirely a different build than the prior 2 years. Their next phone will be an update to the iPhone X, let's say it's called iPhone X-II or X-S. Now what this causes from an earnings view is this: the YOY comps are tough to beat...very simply the "S" update on the iPhone never does as well as the new-form-factor cycle. AAPL has started to see stalled growth & back in 2016 we saw AAPL's first quarters show negative growth for the quarters ahead on a YOY basis when compared to the new-form-factor cycle. So yes, the quarter ahead into this year will all likely be much stronger in earnings / revenue / units sold but that's why the stock has already run up 100% from the $89 bottom. AAPL's chart runs ahead of schedule in anticipation of future earnings growth. If history is any suggestion, what's likely to happen from here is that AAPL's share price will start to trade in a downtrend in anticipation of 2019's lackluster comps relative to 2018 comps. That's how this works.
A (technical analysis) will almost always follow the fundamental narrative. So what is
Almost a year ago back in May of 2017, we published a key AAPL post titled:
The Most Important Chart on AAPL - Bull & Bear Cycles
Let's now update that view here and see where we're at:

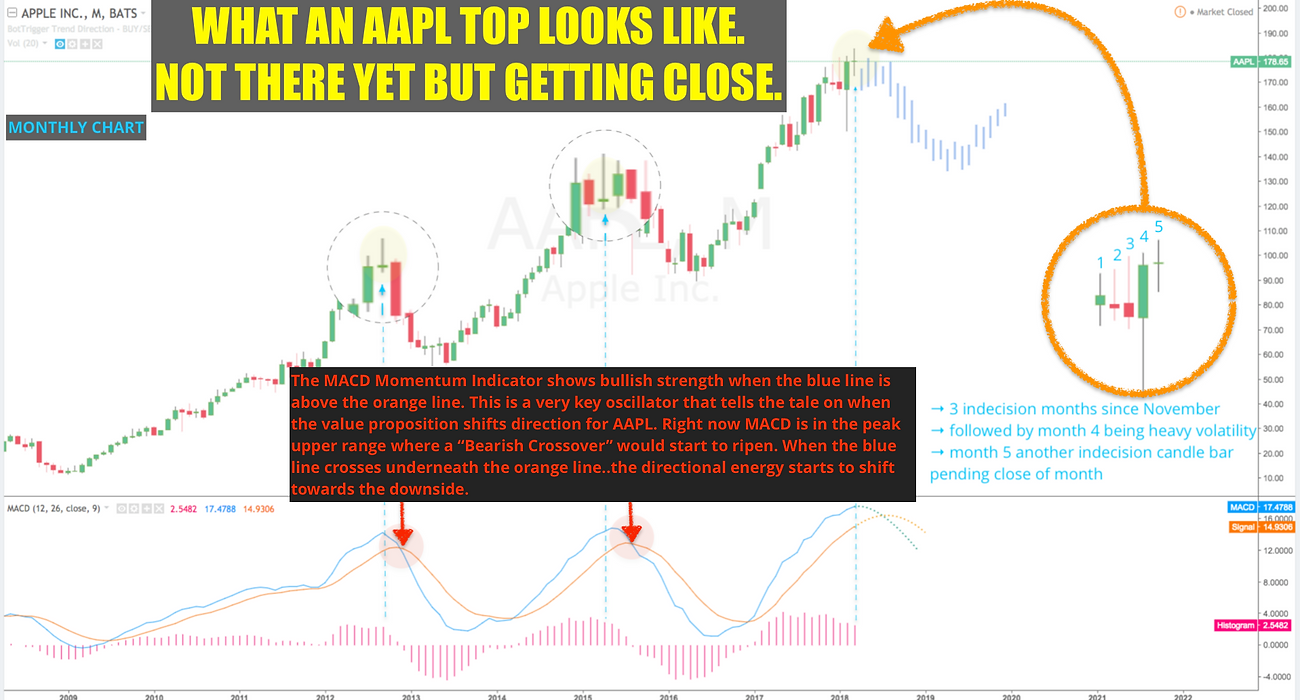
The purpose of this monthly candle-bar chart is to illustrate the CORRELATIVE BEHAVIOR & cultivation that occurs from the above indicators when AAPL is starting to reverse direction, either into a bullish or bearish direction. We look at the Monthly chart to see the bigger picture so that we can identify big trend moves and then model a trade setup to capture yield based on that directional change. There are several key signals that start to show up in spades on the chart when there is a macro-directional shift on AAPL. Think of them as steering indicators. For example, AAPL simply can't sustain higher prices when the MACD indicator is in a "bearish crossover" as shown in the bottom panel of the chart.
The MACD is a very key momentum oscillator that tells the tale on when the value proposition shifts to the downside for AAPL. When we get the blue line crossing underneath the red line we tend to get a confirmed bearish cycle. As of now, we can see that AAPL
There is no Holy Grail indicator, but there is a King Indicator which is price. Price action is always King. When it comes to using indicators however, what we're looking for is an alignment of confluence among the major key indicators that line up and sing the same tune. They need to confer with one another for us to lay strong conviction down on a trade setup. The more alignment we have, the higher the probability of the setup. It's really that simple.
The most important indicators when you're discerning for AAPL's major bull & bear cycles are the following 5:
Monthly Stochastics Indicator
Monthly MACD Histogram Values
Trading above/below the 6, 9, & 12 month moving average
Trading above/below a major ascending/descending trend line
PRICE ACTION is the king indicator that needs to confirm everything above
BEHAVIOR OF KEY INDICATORS IN BULLISH & BEARISH ENVIRONMENTS:
1) Monthly Stochastics Indicator begins a bearish crossover (indicator in bottom panel). When you see the monthly stochastics (indicator in 2nd panel) in a bearish crossover (red line crossing BELOW the blue line), coming off a major rally/top then it means to get the F out of the way and let the stock go. Now this needs to be conferred upon with the other major indicators being discussed in 2 - 5.
I can't stress this enough, it's absolutely imperative to see more than one key signal confer with the others. Take notice of the 2 false flags that showed up in the following chart as shown here in 2010 & again in 2011:

2) Monthly MACD Histogram Indicator: when you see the first negative decline from the month prior...it usually means that momentum is waning as distribution starts to overpower the order book with more sell-orders taking the BIDng price from buyers. So there is less negotiation between buyers and sellers as sellers fill the bidding price more often than not. This results in declining MACD histogram values. When this starts to happen, there is a high chance decline in share price to form into an eventual downtrend off the bottom. Again, other indicators working in confluence here needs to be confirmed. You can't simply rely on MACD histo. You have to look at the holistic, entire view.
3) Monthly Moving Averages - 6 & 9 Month
When share price starts trading below the 6 (faster) & then the 9 month (slower) moving averages it means that sentiment has assuredly shifted as the stock starts to begin sloping down over the weeks and months. Bounces give the illusion of a sustainable or renewed uptrend but those tend to be sold off as the weight of the downwards slope continues. Think of these macro moving averages as sentiment indicators.
4) Major Trend Lines: trading below a major ascending trendline off the top range is also another signal that the weight of shares have now tilted to the down side. Again, increased downside momentum means that strong conviction buyers are fleeting. Value buyers wait for absurd oversold or undervalued levels before accumulating shares. When you see the weight shift like this, it's now easier for sellers orders to fill the ladder book down of buyers. A break of a key trend line is showing you that the buyers haven't shown up to defend the stock. If strong buyers aren't there then there is little edge to be long.
5) Price-Action: this is the KING indicator as we've always mentioned. Nothing matters most than what the price action is telling you. We can have every bullish or bearish indicator conferring with one another that a bearish/bullish move is about to happen but price action is the ultimate signal. In a bullish environment we'll see Price-Action start to put up new highs and lower lows on the near term, intermediate term, & primary term time frame. Just remember that one down day does not make a trend. And inversely, one up day or down day does not make a trend. It's how price cultivates over time. In a downtrend, Price Action will start to cultivate a set of lower-highs & lower-lows and in a confirmed uptrend price will form a series of higher-highs, & higher-lows.
So we just layed out a recap of how to best interpret the charts above. In a bearish environment you'll see all the above happen....and inversely, in a bullish environment you'll see both the MACD & Stochastics indicator start to crossover into a bullish crossover. MACD histogram will increase in value from the month prior and you'll see share price above the 6 month moving average and then the 9 month MA, etc....Price-Action will push to new intermediate term highs. That's a bull environment and that's the exact environment AAPL has pushed through since summer of 2016.
However, as we can see from the charts above...we're already starting to see AAPL show bearish signals on the monthly time frames that suggest that bull cycle is coming nearer to the end.
We may get 1 more pulse small wave higher but, that will very likely be the last gasp before a seasonal correction strides in. If AAPL shows us otherwise along the way, we will gladly update our view. There are fundamental catalysts that could derail the short thesis. Most notably is AAPL's stock repurchase program. In the Q1 Earnings call, Apple's CFO Maestri announced that they will update their plans to buy dividends & stock buybacks next quarter. If it's above and beyond what the buyback program has been in the last 2 years, then we would be hard pressed to initiate the big short on AAPL. Ultimately, the technicals on the chart will behave to the fundamental narrative on AAPL. It's an easy one to see. Again, look at the chart above ^ above here. If we see a bearish crossover on MACD, it pretty much has always meant...GTFO...stocks coming down.
We've covered a cursory overview of some of the key indicators we'll be watching. We've catalogued a more comprehensive check-list of weighted signals (some signals have more fear / cheer than others).

Right now in the current setup on AAPL, we have 4 of 9 signals checked off that are in bear territory. There are few key others that will show themselves once March closes the month out. It's still to early to judge at least until March is complete and then especially once we get more color on the April earnings call. We are watching.


Comments